528
Views
9
CrossRef citations to date
0
Altmetric
Research Article

Could it be advantageous to tune the temperature controller during radiofrequency ablation? A feasibility study using theoretical models

, , &
Pages 539-548 | Received 20 Sep 2010, Accepted 05 May 2011, Published online: 16 Aug 2011

Figures & data

Figure 1. Two-dimensional theoretical model used. The active electrode tip is inserted into cardiac tissue with an insertion depth P. The dimensions R, Z and L are obtained by means of a sensitivity analysis.
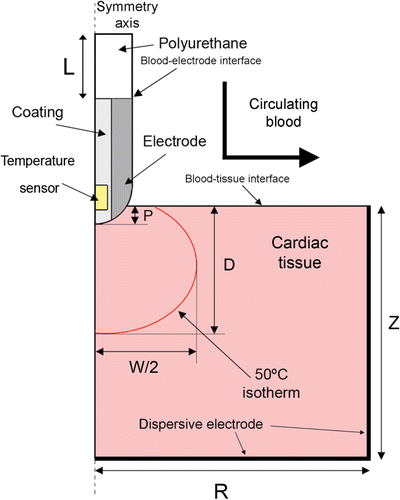
Figure 1. Two-dimensional theoretical model used. The active electrode tip is inserted into cardiac tissue with an insertion depth P. The dimensions R, Z and L are obtained by means of a sensitivity analysis.

Figure 2. Detail of the two types of active electrodes considered the study. Le is total electrode total length in (mm) and S is the electrode radius (in Fr), C is the layer of coating around the temperature sensor (C = 0.4 mm). The temperature sensor dimensions are 0.75 × 0.3 mm for type A, and 0.75 × 0.15 mm for type B. Point T indicates the place where temperature is assessed to implement the PI controller. The parameter w is the distance between location of P and electrode surface.
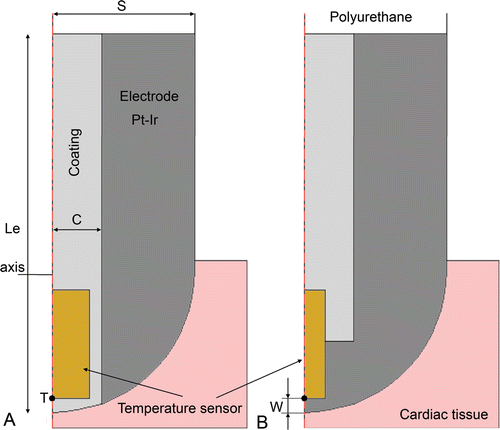
Figure 2. Detail of the two types of active electrodes considered the study. Le is total electrode total length in (mm) and S is the electrode radius (in Fr), C is the layer of coating around the temperature sensor (C = 0.4 mm). The temperature sensor dimensions are 0.75 × 0.3 mm for type A, and 0.75 × 0.15 mm for type B. Point T indicates the place where temperature is assessed to implement the PI controller. The parameter w is the distance between location of P and electrode surface.

Figure 3. Interface between COMSOL and MATLAB in the model of temperature-controlled RF ablation. The electric–thermal coupled problem was solved by means of COMSOL, while MATLAB was used to implement the PI control algorithm.
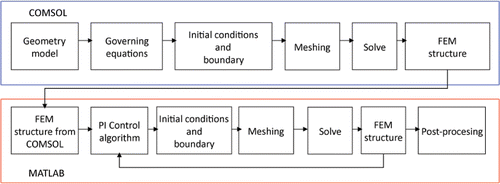
Figure 3. Interface between COMSOL and MATLAB in the model of temperature-controlled RF ablation. The electric–thermal coupled problem was solved by means of COMSOL, while MATLAB was used to implement the PI control algorithm.

Table I.  Characteristics of the materials used in the model Citation[7], Citation[10].

Figure 4. Implementation of the temperature-controlled protocol inside the RF generator. The controller uses the error signal (e), which is the difference between the temperature measured at the electrode tip (Tm) and the target temperature set by the user. This signal is used by the PI controller to create an output signal (u) which modulates the output amplitude of a RF oscillator.
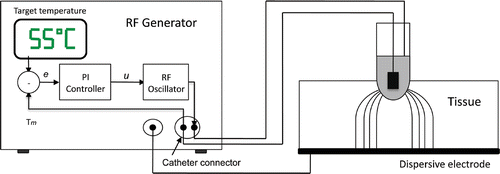
Figure 4. Implementation of the temperature-controlled protocol inside the RF generator. The controller uses the error signal (e), which is the difference between the temperature measured at the electrode tip (Tm) and the target temperature set by the user. This signal is used by the PI controller to create an output signal (u) which modulates the output amplitude of a RF oscillator.

Figure 5. Block diagram of control system. The error signal e is the difference between the target temperature Tt and the temperature measured by the thermistor at the active electrode Tm. The applied voltage is modulated by means of the signal u. The dynamic system modelled by FEM includes the RF oscillator and the biological tissue.
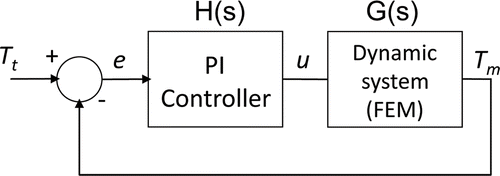
Figure 5. Block diagram of control system. The error signal e is the difference between the target temperature Tt and the temperature measured by the thermistor at the active electrode Tm. The applied voltage is modulated by means of the signal u. The dynamic system modelled by FEM includes the RF oscillator and the biological tissue.

Table II.  Description of the analysed cases including changes both in tissue characteristics Citation[4] and electrode–tissue contact characteristics Citation[10].

Table III.  Description of the analysed cases considering variation in the electrode characteristics Citation[11–16].

Figure 6. Parameters used to study the dynamic response of each controller. The parameter tr is the time taken to reach target temperature (Tt). Once a step change in blood flow occurs during the ablation, we considered the following parameters to define the behaviour of the controller: ΔT is the maximum variation of the temperature in the active electrode. ΔV is maximum variation of voltage applied by RF generator, and ttrans is the duration of the transient time needed to return to the target temperature. The step blood flow was modelled as a change in the thermal convection coefficient at the electrode–blood and tissue–blood interface.
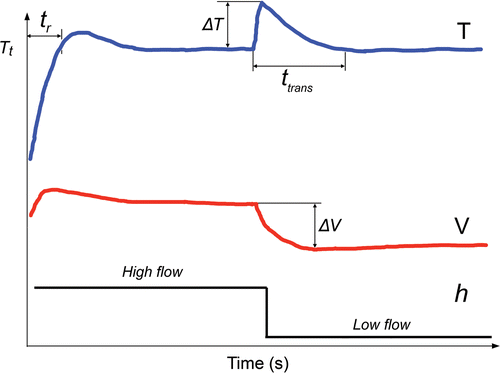
Figure 6. Parameters used to study the dynamic response of each controller. The parameter tr is the time taken to reach target temperature (Tt). Once a step change in blood flow occurs during the ablation, we considered the following parameters to define the behaviour of the controller: ΔT is the maximum variation of the temperature in the active electrode. ΔV is maximum variation of voltage applied by RF generator, and ttrans is the duration of the transient time needed to return to the target temperature. The step blood flow was modelled as a change in the thermal convection coefficient at the electrode–blood and tissue–blood interface.

Table IV.  The Kp and Ki parameters for the specific PI controllers.

Table V.  Results obtained using the standard PI controller (Std PI) and the specific PI controller when characteristics are changed (cases).

Figure 7. Temperature distributions in the cardiac tissue at 120 s (scale in °C) using the standard PI controller and the electrode type A and B (see for more details). The solid black line represents the 50°C isotherm (thermal lesion boundary). The lesion was 6.8 mm wide, 4.9 mm deep and maximum temperature was 66.2°C with type A, and 11.6 mm width, 7.9 mm depth and the maximum temperature of 100.1°C with type B.
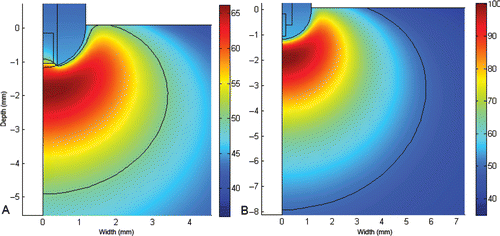
Figure 7. Temperature distributions in the cardiac tissue at 120 s (scale in °C) using the standard PI controller and the electrode type A and B (see Figure 2 for more details). The solid black line represents the 50°C isotherm (thermal lesion boundary). The lesion was 6.8 mm wide, 4.9 mm deep and maximum temperature was 66.2°C with type A, and 11.6 mm width, 7.9 mm depth and the maximum temperature of 100.1°C with type B.

Figure 8. Evolution of the electrode temperature on different cases when a step of high-to-low blood flow occurred at 60 s.
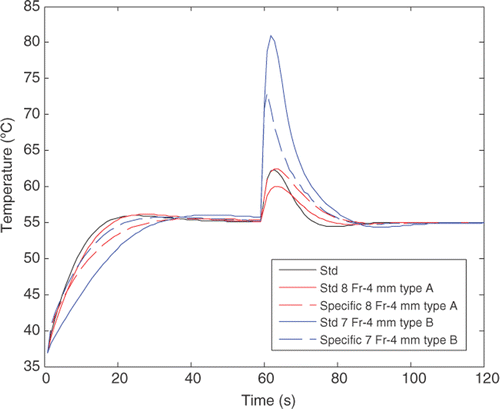
Figure 8. Evolution of the electrode temperature on different cases when a step of high-to-low blood flow occurred at 60 s.

Reprints and Corporate Permissions

Please note: Selecting permissions does not provide access to the full text of the article, please see our help page How do I view content?

To request a reprint or corporate permissions for this article, please click on the relevant link below:

Academic Permissions

Please note: Selecting permissions does not provide access to the full text of the article, please see our help page How do I view content?

Obtain permissions instantly via Rightslink by clicking on the button below:

If you are unable to obtain permissions via Rightslink, please complete and submit this Permissions form. For more information, please visit our Permissions help page.