453
Views
16
CrossRef citations to date
0
Altmetric
Research Article

In vivo comparison of simultaneous versus sequential injection technique for thermochemical ablation in a porcine model

, , , , , , & show all
Pages 105-112 | Received 08 Aug 2011, Accepted 22 Nov 2011, Published online: 15 Feb 2012

Figures & data

Figure 1 Bar graph depiction of peak temperatures measured at thermocouple for (L to R) saline sham, simultaneous injection, sequential injection, and acid-only injection. All solutions had been warmed to 39–40°C (pig body temperature) prior to placing into a syringe pump with extension tubing to the device. SIM, simultaneous injection; SEQ, sequential injection.
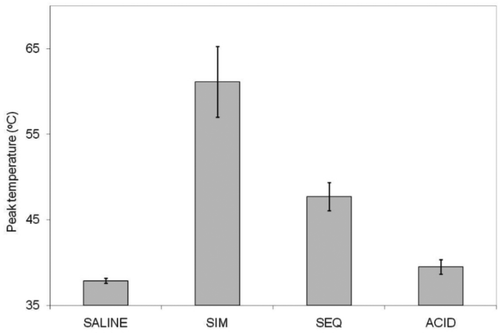
Figure 1 Bar graph depiction of peak temperatures measured at thermocouple for (L to R) saline sham, simultaneous injection, sequential injection, and acid-only injection. All solutions had been warmed to 39–40°C (pig body temperature) prior to placing into a syringe pump with extension tubing to the device. SIM, simultaneous injection; SEQ, sequential injection.

Figure 2 Histology: Gross and corresponding histologic sections after acid (A, B, C), simultaneous (D, E, F) or sequential (G, H, I) injection. Cells in ablated regions exhibit coagulative necrosis and are shrunken with pale cytoplasm and indistinct nuclei compared to unablated tissue (inset, C). Haemorrhage is obvious in simultaneous and sequential sections (E, F). Imaging marker (spaghetti) is visible in histological sections (B, C, stars). A, D, G: Bar equals 1 cm. B, E, H: H&E, 40× magnification, bar equals 500 µm. C, F, I: H&E, 400× magnification, bar equals 50 µm.
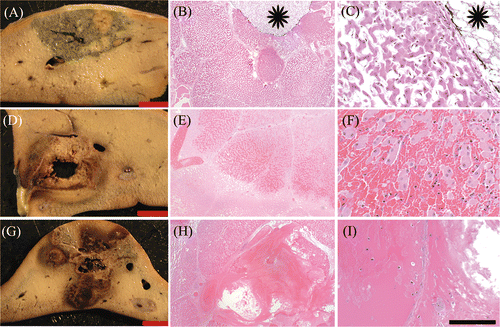
Figure 2 Histology: Gross and corresponding histologic sections after acid (A, B, C), simultaneous (D, E, F) or sequential (G, H, I) injection. Cells in ablated regions exhibit coagulative necrosis and are shrunken with pale cytoplasm and indistinct nuclei compared to unablated tissue (inset, C). Haemorrhage is obvious in simultaneous and sequential sections (E, F). Imaging marker (spaghetti) is visible in histological sections (B, C, stars). A, D, G: Bar equals 1 cm. B, E, H: H&E, 40× magnification, bar equals 500 µm. C, F, I: H&E, 400× magnification, bar equals 50 µm.

Figure 3 Vascular damage adjacent to ablated region. Fibrin and neutrophils (arrow) adhere to vascular endothelium in vessel adjacent to viable hepatocytes. H&E, 200× magnification. Bar equals 50 µm.
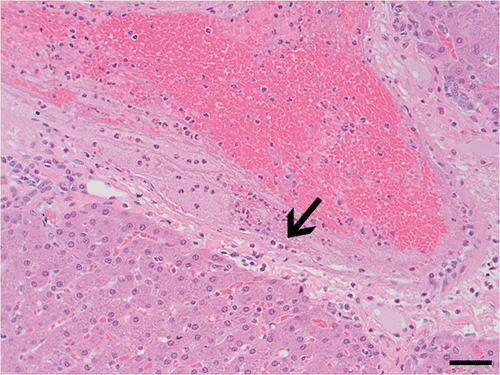
Figure 3 Vascular damage adjacent to ablated region. Fibrin and neutrophils (arrow) adhere to vascular endothelium in vessel adjacent to viable hepatocytes. H&E, 200× magnification. Bar equals 50 µm.

Figure 4 Gross pathology correlations with adjacent CT rendering corresponding in each case. Acetic acid alone (A, B), simultaneous injection (C, D), sequential injection (E, F). Note that although acid alone correlates fairly well, with either of the two other methods there is inconsistent density and/or shape compared to CT.
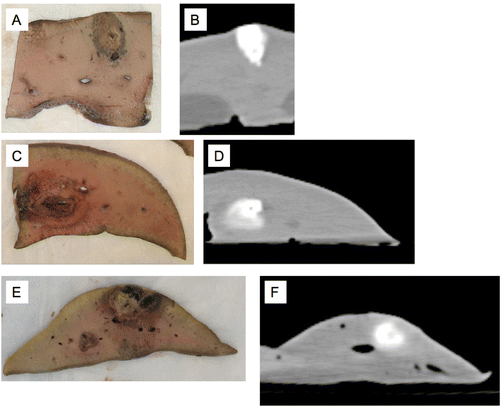
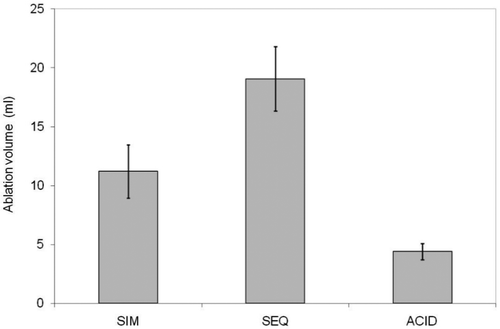
Figure 4 Gross pathology correlations with adjacent CT rendering corresponding in each case. Acetic acid alone (A, B), simultaneous injection (C, D), sequential injection (E, F). Note that although acid alone correlates fairly well, with either of the two other methods there is inconsistent density and/or shape compared to CT.
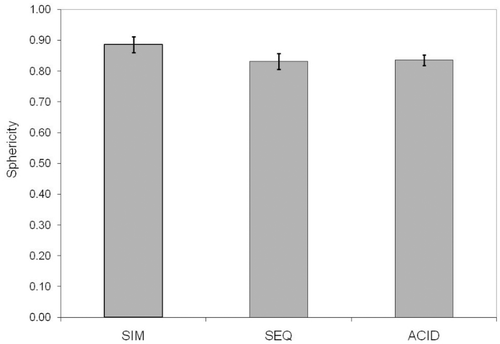
Figure 5 Bar graph illustrating average summation volumes of zones of coagulation for simultaneous injection (SIM), sequential injection (SEQ), and acid alone. Saline sham is not listed as no detectable lesion was identified in that case.

Figure 5 Bar graph illustrating average summation volumes of zones of coagulation for simultaneous injection (SIM), sequential injection (SEQ), and acid alone. Saline sham is not listed as no detectable lesion was identified in that case.

Figure 6 Bar graph depiction of sphericity coefficients for simultaneous (SIM), sequential (SEQ), and acid-only injection. Saline sham is not listed as no detectable lesion was identified in that case.

Figure 6 Bar graph depiction of sphericity coefficients for simultaneous (SIM), sequential (SEQ), and acid-only injection. Saline sham is not listed as no detectable lesion was identified in that case.

Reprints and Corporate Permissions

Please note: Selecting permissions does not provide access to the full text of the article, please see our help page How do I view content?

To request a reprint or corporate permissions for this article, please click on the relevant link below:

Academic Permissions

Please note: Selecting permissions does not provide access to the full text of the article, please see our help page How do I view content?

Obtain permissions instantly via Rightslink by clicking on the button below:

If you are unable to obtain permissions via Rightslink, please complete and submit this Permissions form. For more information, please visit our Permissions help page.