1,431
Views
63
CrossRef citations to date
0
Altmetric
RESEARCH ARTICLE

Tumour hyperthermia and ablation in rats using a clinical MR‐HIFU system equipped with a dedicated small animal set‐up

, , , , , & show all
Pages 141-155 | Received 12 Aug 2011, Accepted 05 Dec 2011, Published online: 15 Feb 2012

Figures & data

Figure 1. (A) The acoustic window in the bottom of the small animal HIFU‐compatible MR coil (dimensions 10 × 10 cm2) with the copper strip in the middle. (B) The coil fixed inside the water pool and installed on the patient bed of the MR scanner. (C) Side view of the animal bed design. The space between the foil layers (indicated by the arrow) was filled with degassed water and ultrasound gel. (D) Top view of the animal bed showing the details of the design.
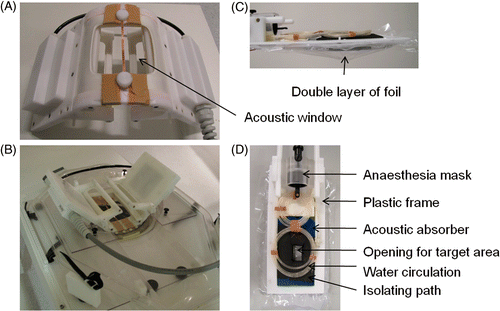
Figure 1. (A) The acoustic window in the bottom of the small animal HIFU‐compatible MR coil (dimensions 10 × 10 cm2) with the copper strip in the middle. (B) The coil fixed inside the water pool and installed on the patient bed of the MR scanner. (C) Side view of the animal bed design. The space between the foil layers (indicated by the arrow) was filled with degassed water and ultrasound gel. (D) Top view of the animal bed showing the details of the design.

Figure 2. Schematic drawing of the small animal set‐up. The bars indicate the position of the four different coil elements. The bar (green/red) below the tumour is shared by the bottom two elements of the coil. P, posterior; L, left; R, right.
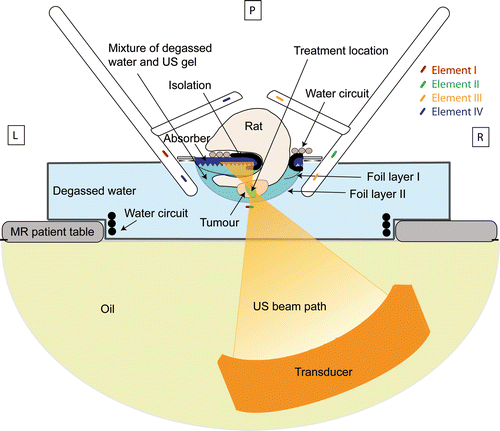
Figure 2. Schematic drawing of the small animal set‐up. The bars indicate the position of the four different coil elements. The bar (green/red) below the tumour is shared by the bottom two elements of the coil. P, posterior; L, left; R, right.

Figure 3. (A) Sagittal T2‐weighted full body image acquired to plan the therapy. (B) Detailed transversal T2‐weighted image at tumour location acquired with the sequence used for immediate evaluation of the treatment effects. (C) Magnitude image of the temperature mapping sequence in a scan plane perpendicular to the HIFU beam at the tumour location. T, tumour; L, leg; F, foot.
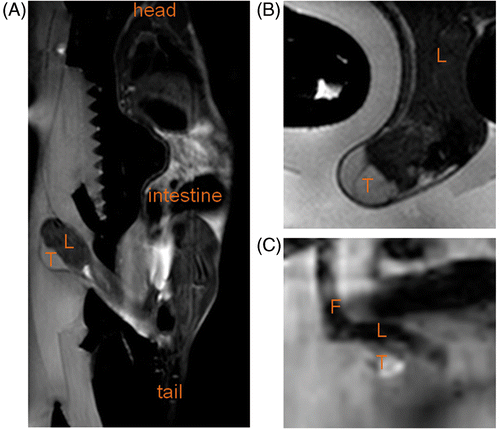
Figure 3. (A) Sagittal T2‐weighted full body image acquired to plan the therapy. (B) Detailed transversal T2‐weighted image at tumour location acquired with the sequence used for immediate evaluation of the treatment effects. (C) Magnitude image of the temperature mapping sequence in a scan plane perpendicular to the HIFU beam at the tumour location. T, tumour; L, leg; F, foot.

Figure 4. Stability of the temperature change measurements over 15 min, measured in a phantom and in in vivo tumour tissue without heating.
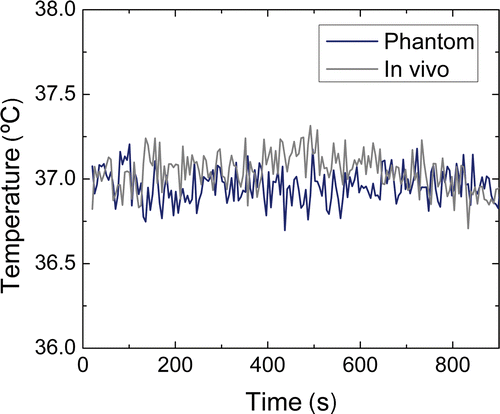
Figure 4. Stability of the temperature change measurements over 15 min, measured in a phantom and in in vivo tumour tissue without heating.

Table I.  Overview of the performed animal experiments.

Figure 5. Temperature distribution during (A) hyperthermia on tumour and (B) ablation on tumour. Plots show respectively an image of the temperature mapping during treatment, in which the colours indicate the temperature distribution and the red contour indicates the tumour area, an anatomical image of the animal leg with tumour with an overlay of the thermal dose contour (acquired at the end of the therapy, orange line indicates 30 EM dose contour, white line indicates 240 EM dose contour; F, feet; M, lower leg muscle; A, planned location of the treatment cell centre). Furthermore, the evolution of the maximum temperature in time and the spatial distribution of the temperature elevation are plotted. The dotted lines indicate the end of the sonication in the temporal temperature profiles and the size of the treatment cell in the spatial temperature profiles. For the tumour ablation, an extra plot is included showing the spatial distribution of the thermal dose are shown. FH, feet–head; LR, left–right.
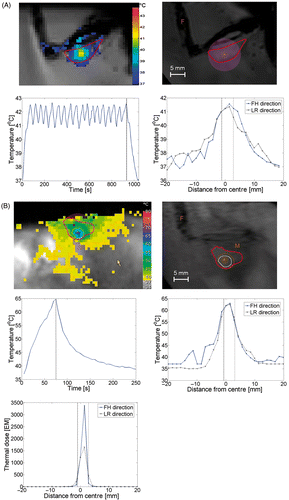
Figure 5. Temperature distribution during (A) hyperthermia on tumour and (B) ablation on tumour. Plots show respectively an image of the temperature mapping during treatment, in which the colours indicate the temperature distribution and the red contour indicates the tumour area, an anatomical image of the animal leg with tumour with an overlay of the thermal dose contour (acquired at the end of the therapy, orange line indicates 30 EM dose contour, white line indicates 240 EM dose contour; F, feet; M, lower leg muscle; A, planned location of the treatment cell centre). Furthermore, the evolution of the maximum temperature in time and the spatial distribution of the temperature elevation are plotted. The dotted lines indicate the end of the sonication in the temporal temperature profiles and the size of the treatment cell in the spatial temperature profiles. For the tumour ablation, an extra plot is included showing the spatial distribution of the thermal dose are shown. FH, feet–head; LR, left–right.

Figure 6. T2‐weighted images, T1‐weighted DCE‐MRI images and parametric maps of ktrans [min− 1], kep [min−1] and ve [–] of the treated area before and after (A) hyperthermia treatment (data animal 2) and (B) ablation treatment of the tumour (data animal 7). A red ROI is manually drawn around the tumour in the parametric maps. The orange arrow points at local oedema visible after HIFU ablation treatment on the T2‐weighted scan. hyp, hyperthermia; ab, ablation.

Figure 6. T2‐weighted images, T1‐weighted DCE‐MRI images and parametric maps of ktrans [min− 1], kep [min−1] and ve [–] of the treated area before and after (A) hyperthermia treatment (data animal 2) and (B) ablation treatment of the tumour (data animal 7). A red ROI is manually drawn around the tumour in the parametric maps. The orange arrow points at local oedema visible after HIFU ablation treatment on the T2‐weighted scan. hyp, hyperthermia; ab, ablation.

Figure 7. Change in pharmacologic parameters per animal study after HIFU treatment. For treatment parameters see .
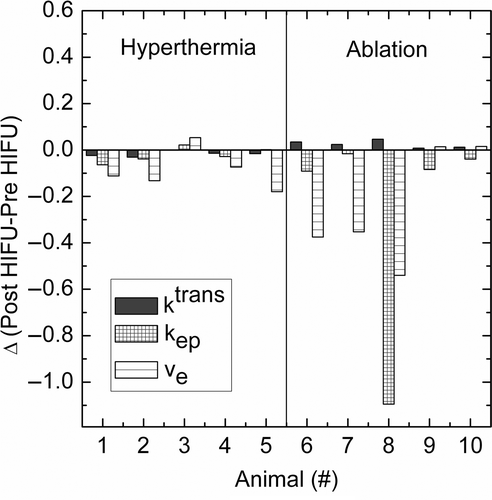
Figure 7. Change in pharmacologic parameters per animal study after HIFU treatment. For treatment parameters see Table I.

Figure 8. NADH‐diaphorase staining after (A) tumour hyperthermia and (B) tumour ablation. In the hyperthermia experiments, all tissue is viable. In the ablation experiments a clearly defined area of non‐viable tissue is visible. The black box indicates the areas from which the high magnification images were taken. v, viable tissue; n, non‐viable tissue.
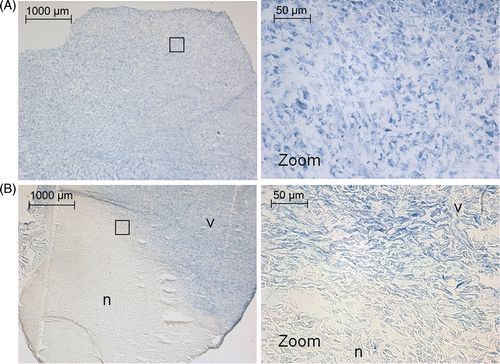
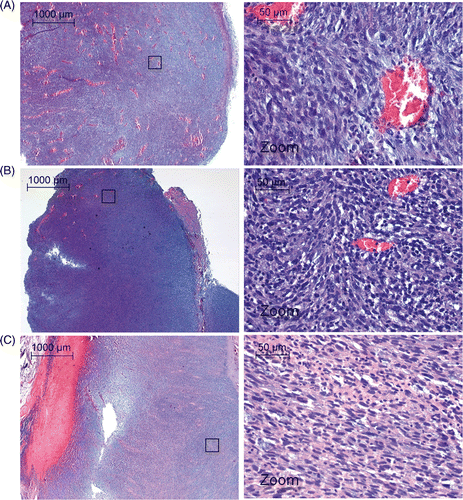
Figure 8. NADH‐diaphorase staining after (A) tumour hyperthermia and (B) tumour ablation. In the hyperthermia experiments, all tissue is viable. In the ablation experiments a clearly defined area of non‐viable tissue is visible. The black box indicates the areas from which the high magnification images were taken. v, viable tissue; n, non‐viable tissue.

Figure 9. H&E staining after (A) tumour hyperthermia, (B) 1.5 h post tumour ablation and (C) 4 days post tumour ablation. The black box indicates the areas from which the high magnification images were taken.

Figure 9. H&E staining after (A) tumour hyperthermia, (B) 1.5 h post tumour ablation and (C) 4 days post tumour ablation. The black box indicates the areas from which the high magnification images were taken.

Reprints and Corporate Permissions

Please note: Selecting permissions does not provide access to the full text of the article, please see our help page How do I view content?

To request a reprint or corporate permissions for this article, please click on the relevant link below:

Academic Permissions

Please note: Selecting permissions does not provide access to the full text of the article, please see our help page How do I view content?

Obtain permissions instantly via Rightslink by clicking on the button below:

If you are unable to obtain permissions via Rightslink, please complete and submit this Permissions form. For more information, please visit our Permissions help page.