655
Views
12
CrossRef citations to date
0
Altmetric
RESEARCH ARTICLE

Determining a minimal safe distance to prevent thermal injury to intrahepatic bile ducts in radiofrequency ablation of the liver: A study in dogs

, , , , , , , , & show all
Pages 210-217 | Received 07 Oct 2011, Accepted 25 Jan 2012, Published online: 19 Apr 2012

Figures & data

Figure 1. (A) Image showing the hepatic anatomy of dogs and the proximity of the target hepatic duct to the necrotic area induced by RFA treatment. (B, C) Complete necrosis of the bile duct wall was observed with the development of abdominal adhesions and bile peritonitis when the liver was removed 24 h after RFA. (D) Abdominal infection and inflammatory exudates were observed when liver removal was performed 2 weeks after RFA. GB, gallbladder; CBD, common bile duct; LBD, left bile duct; LHD, left hepatic duct.
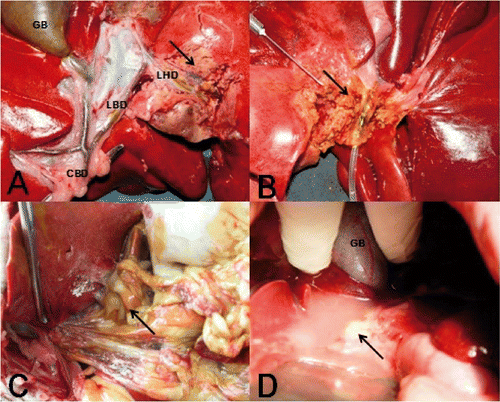
Figure 1. (A) Image showing the hepatic anatomy of dogs and the proximity of the target hepatic duct to the necrotic area induced by RFA treatment. (B, C) Complete necrosis of the bile duct wall was observed with the development of abdominal adhesions and bile peritonitis when the liver was removed 24 h after RFA. (D) Abdominal infection and inflammatory exudates were observed when liver removal was performed 2 weeks after RFA. GB, gallbladder; CBD, common bile duct; LBD, left bile duct; LHD, left hepatic duct.

Figure 2. Recovery among the treatment groups at different times after RFA. Nineteen animals (95%) were in recovery in groups III and IV (≥5 mm) at over 72 h post-RFA. In comparison, 11 animals (55%) were in recovery in groups I and II (<5 mm) at over 72 h post-RFA.
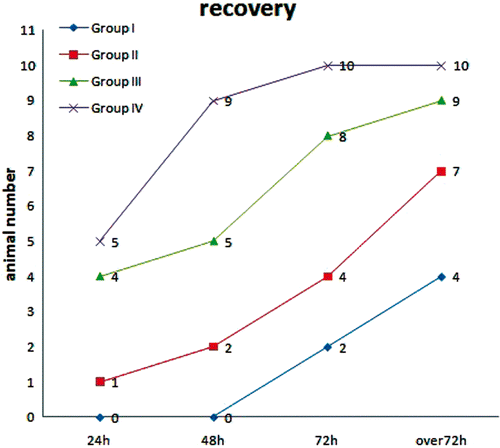
Figure 2. Recovery among the treatment groups at different times after RFA. Nineteen animals (95%) were in recovery in groups III and IV (≥5 mm) at over 72 h post-RFA. In comparison, 11 animals (55%) were in recovery in groups I and II (<5 mm) at over 72 h post-RFA.

Table I.  Radiological abnormalities according to the distance between the RFA electrode tip and intrahepatic bile ducts.

Table II.  Radiological abnormalities according to the distance (<5 mm or ≥5 mm) between the RFA electrode tip and intrahepatic bile ducts.

Table III.  Histological lesions of the intrahepatic ducts according to the distance between the RFA electrode tip and intrahepatic bile ducts (<5 mm or ≥5 mm).

Figure 3. Histopathological examinations in the different study groups. (A) Histological appearance (H&E) of the necrotic bile duct (BD) wall after hepatic RFA in group I. Liver removal was performed 2 weeks after RFA. There was total destruction of epithelial cells and the subepithelial glands of the bile ducts. The bile duct wall showed full thickness necrosis, with extensive cytolysis, karyolysis, collagen degeneration, fibrosis and hyalinisation, and loss of bile duct histological structure. Necrosis (N) of the entire bile duct wall was evident (original magnification HE × 200). (B) Histological appearance of incomplete necrosis of the bile ducts in samples from group 2. The bile duct walls showed partial thickness necrosis, the epithelium was dislocated, collagen fibers were swollen and hyperplastic, and fibroblasts were infiltrating. However, part of the glandular structure remained (original magnification H&E × 200). (C) Most samples from group III showed vacuolar changes within the epithelial cytoplasm (original magnification H&E × 400). (D) There were no relevant changes in the epithelium of bile duct samples from group IV animals (original magnification H&E × 400).
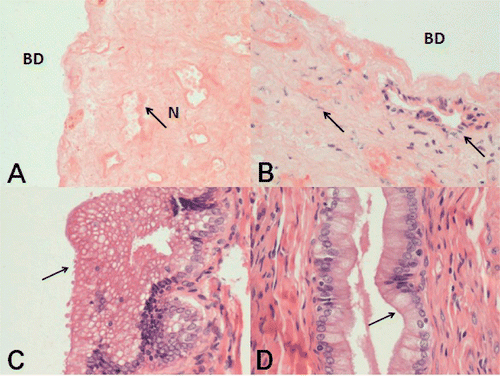
Figure 3. Histopathological examinations in the different study groups. (A) Histological appearance (H&E) of the necrotic bile duct (BD) wall after hepatic RFA in group I. Liver removal was performed 2 weeks after RFA. There was total destruction of epithelial cells and the subepithelial glands of the bile ducts. The bile duct wall showed full thickness necrosis, with extensive cytolysis, karyolysis, collagen degeneration, fibrosis and hyalinisation, and loss of bile duct histological structure. Necrosis (N) of the entire bile duct wall was evident (original magnification HE × 200). (B) Histological appearance of incomplete necrosis of the bile ducts in samples from group 2. The bile duct walls showed partial thickness necrosis, the epithelium was dislocated, collagen fibers were swollen and hyperplastic, and fibroblasts were infiltrating. However, part of the glandular structure remained (original magnification H&E × 200). (C) Most samples from group III showed vacuolar changes within the epithelial cytoplasm (original magnification H&E × 400). (D) There were no relevant changes in the epithelium of bile duct samples from group IV animals (original magnification H&E × 400).

Table IV.  Comparisons of total bilirubin (TBIL) between the treatment groups at different times after RFA.

Table V.  Comparisons of direct bilirubin (DBIL) between the treatment groups at different times after RFA.

Reprints and Corporate Permissions

Please note: Selecting permissions does not provide access to the full text of the article, please see our help page How do I view content?

To request a reprint or corporate permissions for this article, please click on the relevant link below:

Academic Permissions

Please note: Selecting permissions does not provide access to the full text of the article, please see our help page How do I view content?

Obtain permissions instantly via Rightslink by clicking on the button below:

If you are unable to obtain permissions via Rightslink, please complete and submit this Permissions form. For more information, please visit our Permissions help page.