505
Views
8
CrossRef citations to date
0
Altmetric
RESEARCH ARTICLE

Temperature superposition for fast computation of 3D temperature distributions during optimization and planning of interstitial ultrasound hyperthermia treatments

, &
Pages 235-249 | Received 03 Nov 2011, Accepted 26 Jan 2012, Published online: 19 Apr 2012

Figures & data

Table 1.  List of parameters used in bioacoustic temperature modelling.

Figure 1. Three-dimensional coordinate transform performed to calculate the ultrasound energy deposited by the ith transducer is illustrated in the Zi = 0 (A) and Yi (or Θi) = 0 (B) planes. The origin of this transformed coordinate system was set at the centre of the transducer tube and the aiming direction was set along the positive Xi axis. The ultrasound energy was assumed as zero for |θi| > Θ/2, where Θ was the active sector angle for the transducer (A). The ultrasound energy was assumed as zero for |zi| > H/2, where H was the height of the transducer (B).
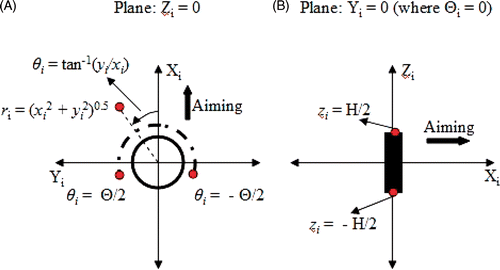
Figure 1. Three-dimensional coordinate transform performed to calculate the ultrasound energy deposited by the ith transducer is illustrated in the Zi = 0 (A) and Yi (or Θi) = 0 (B) planes. The origin of this transformed coordinate system was set at the centre of the transducer tube and the aiming direction was set along the positive Xi axis. The ultrasound energy was assumed as zero for |θi| > Θ/2, where Θ was the active sector angle for the transducer (A). The ultrasound energy was assumed as zero for |zi| > H/2, where H was the height of the transducer (B).

Figure 2. Example of temperature superposition shown with (A) temperature increase due to the first transducer powered at 4 W/cm2 [T1], (B) temperature increase due to the second transducer powered at 4 W/cm2 [T2], (C) approximate temperature increase modelled as the sum of temperature increases due to individual transducers [Tapprox = T1 + T2].

Figure 2. Example of temperature superposition shown with (A) temperature increase due to the first transducer powered at 4 W/cm2 [T1], (B) temperature increase due to the second transducer powered at 4 W/cm2 [T2], (C) approximate temperature increase modelled as the sum of temperature increases due to individual transducers [Tapprox = T1 + T2].

Table 2.  Spatial grid in cylindrical coordinates for creating temperature look-up tables.

Figure 3. To compare temperature distributions calculated for a single four-element applicator using the superposition-based and FEM-based methods, radial temperature profiles have been plotted through the device centre (top row) along with 41°C isotherms estimated in longitudinal planes through the devices (bottom row). The radial temperature plots shown in the top row represent essentially temperature values along the X-axis (positive X-axis is the aiming direction and Z = 0 is the applicator centre). Plots have been generated for devices with (A) 360°, (B) 270° and (C) 180° transducer sectors. The acoustic output of each transducer was set to 3.2 W/cm2. For directional applicators, positive X-axis was set as the aiming direction. A constant blood perfusion of 2 kg/m3/s was assumed.
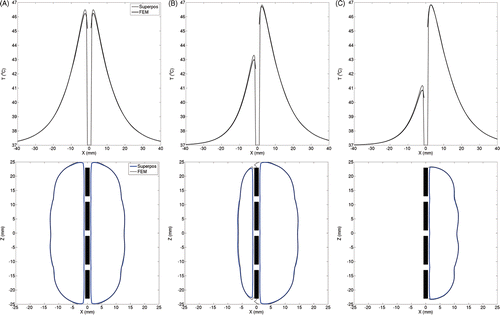
Figure 3. To compare temperature distributions calculated for a single four-element applicator using the superposition-based and FEM-based methods, radial temperature profiles have been plotted through the device centre (top row) along with 41°C isotherms estimated in longitudinal planes through the devices (bottom row). The radial temperature plots shown in the top row represent essentially temperature values along the X-axis (positive X-axis is the aiming direction and Z = 0 is the applicator centre). Plots have been generated for devices with (A) 360°, (B) 270° and (C) 180° transducer sectors. The acoustic output of each transducer was set to 3.2 W/cm2. For directional applicators, positive X-axis was set as the aiming direction. A constant blood perfusion of 2 kg/m3/s was assumed.

Figure 4. Critical isotherms at 41°C and 46.5°C have been calculated using the superposition-based and FEM-based methods in a representative linear implant (similar to posterior peripheral implants from the clinical cases). Results have been plotted for (A) implant with 180° transducers aiming in the positive Y-axis and with each transducer powered to 1.54 W/cm2, (B) implant with 360° transducers and with each transducer was powered to 1.1 W/cm2. Acoustic powers were chosen such that a maximum temperature close to 47°C was obtained. A constant blood perfusion level of 2 kg/m3/s was assumed.
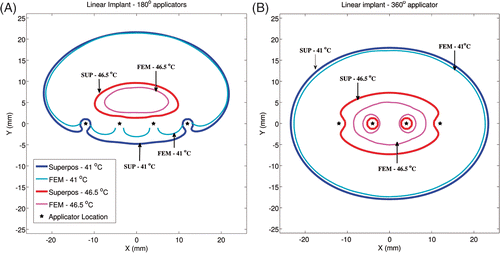
Figure 4. Critical isotherms at 41°C and 46.5°C have been calculated using the superposition-based and FEM-based methods in a representative linear implant (similar to posterior peripheral implants from the clinical cases). Results have been plotted for (A) implant with 180° transducers aiming in the positive Y-axis and with each transducer powered to 1.54 W/cm2, (B) implant with 360° transducers and with each transducer was powered to 1.1 W/cm2. Acoustic powers were chosen such that a maximum temperature close to 47°C was obtained. A constant blood perfusion level of 2 kg/m3/s was assumed.
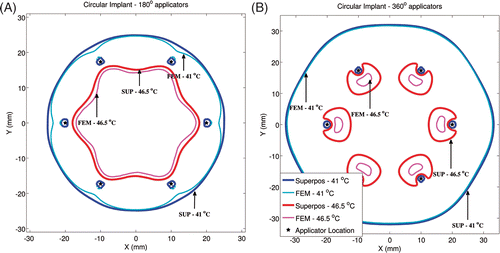
Figure 5. Critical isotherms at 41°C and 46.5°C have been calculated using the superposition- and FEM-based methods in a representative circular implant (similar to peripheral implants from the clinical cases). Results have been plotted for (A) implant with 180° transducers aimed towards the implant's central axis (Z-axis) and with each transducer powered to 1.92 W/cm2, (B) implant with 360° transducers and with each transducer was powered to 1.46 W/cm2. Acoustic powers were chosen such that a maximum temperature close to 47°C was obtained. A constant blood perfusion level of 2 kg/m3/s was assumed.

Figure 5. Critical isotherms at 41°C and 46.5°C have been calculated using the superposition- and FEM-based methods in a representative circular implant (similar to peripheral implants from the clinical cases). Results have been plotted for (A) implant with 180° transducers aimed towards the implant's central axis (Z-axis) and with each transducer powered to 1.92 W/cm2, (B) implant with 360° transducers and with each transducer was powered to 1.46 W/cm2. Acoustic powers were chosen such that a maximum temperature close to 47°C was obtained. A constant blood perfusion level of 2 kg/m3/s was assumed.

Figure 6. To investigate the impact of blood perfusion on the accuracy of superposition models, temperature distributions from a linear implant with 180° transducers have been plotted for two perfusion values. All transducers were powered to 1.2 W/cm2 when perfusion was set to 1 kg/m3/s (A) and to 2.5 W/cm2 when perfusion was set to 5 kg/m3/s (B). Critical isotherms at 41°C and 46.5°C have been plotted from temperature computations performed using the superposition and FEM-based methods. All transducers were aimed along the positive Y-axis. Acoustic powers were chosen such that a maximum temperature close to 47°C was obtained.
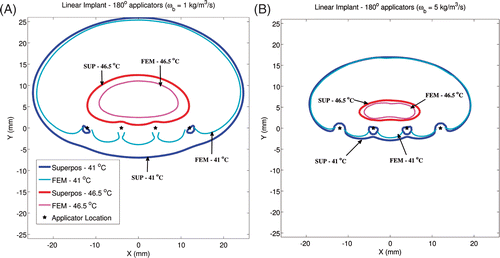
Figure 6. To investigate the impact of blood perfusion on the accuracy of superposition models, temperature distributions from a linear implant with 180° transducers have been plotted for two perfusion values. All transducers were powered to 1.2 W/cm2 when perfusion was set to 1 kg/m3/s (A) and to 2.5 W/cm2 when perfusion was set to 5 kg/m3/s (B). Critical isotherms at 41°C and 46.5°C have been plotted from temperature computations performed using the superposition and FEM-based methods. All transducers were aimed along the positive Y-axis. Acoustic powers were chosen such that a maximum temperature close to 47°C was obtained.

Figure 7. Volumes of critical isotherms at 41°C, 43°C and 45°C have been computed for linear implants (top row) and circular implants (bottom row) with applicators consisting of 180° (A) and 360° (B) transducers driven at increasing acoustic intensities. Isotherm volumes were calculated using both the superposition-based and FEM-based methods. Blood perfusion was assumed to be 2 kg/m3/s for all cases. The highest acoustic intensity value in each panel corresponds to the intensity at which a maximum temperature close to 47°C was computed.
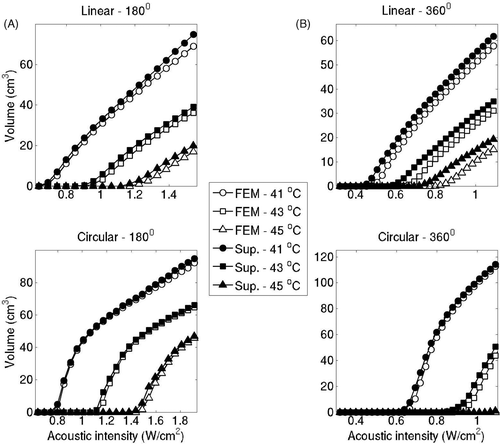
Figure 7. Volumes of critical isotherms at 41°C, 43°C and 45°C have been computed for linear implants (top row) and circular implants (bottom row) with applicators consisting of 180° (A) and 360° (B) transducers driven at increasing acoustic intensities. Isotherm volumes were calculated using both the superposition-based and FEM-based methods. Blood perfusion was assumed to be 2 kg/m3/s for all cases. The highest acoustic intensity value in each panel corresponds to the intensity at which a maximum temperature close to 47°C was computed.
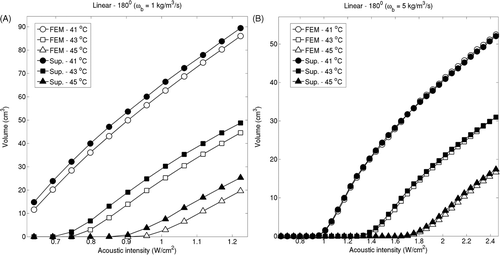
Figure 8. Iso-temperature contour volumes at 41°C, 43°C and 45°C for linear implant with 180° applicators were computed using the superposition-based and FEM-based methods for increasing acoustic intensities for blood perfusion levels of (A) 1 kg/m3/s and (B) 5 kg/m3/s. The highest acoustic intensity value in each panel corresponds to the intensity at which a maximum temperature close to 47°C was computed.

Figure 8. Iso-temperature contour volumes at 41°C, 43°C and 45°C for linear implant with 180° applicators were computed using the superposition-based and FEM-based methods for increasing acoustic intensities for blood perfusion levels of (A) 1 kg/m3/s and (B) 5 kg/m3/s. The highest acoustic intensity value in each panel corresponds to the intensity at which a maximum temperature close to 47°C was computed.

Figure 9. Axial slice views of posterior peripheral (A) and peripheral (B) implants in prostate and peripheral implant (C) in cervix. The first two examples employed 180° applicators and the third 360° applicators. 41°C contours obtained by superposition/FEM hybrid plan (blue), FEM-only plan (white) and superposition-only plan (red) can be seen.
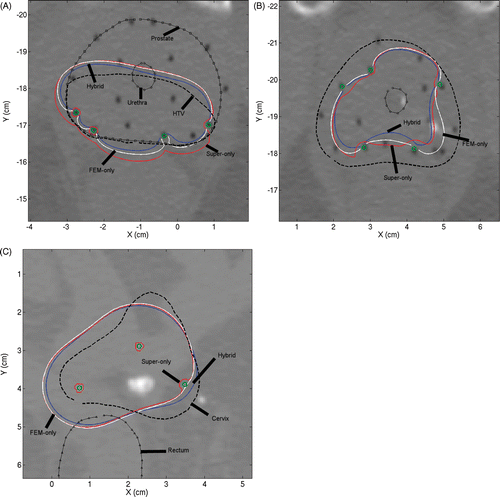
Figure 9. Axial slice views of posterior peripheral (A) and peripheral (B) implants in prostate and peripheral implant (C) in cervix. The first two examples employed 180° applicators and the third 360° applicators. 41°C contours obtained by superposition/FEM hybrid plan (blue), FEM-only plan (white) and superposition-only plan (red) can be seen.

Figure 10. Comparison of optimisation-based planning performance of superposition/FEM hybrid plan (white), FEM-only plan (grey) and superposition-only plan (black) in terms of T90, T50 and T10 for all 15 implant cases. Cases 1–3 correspond to peripheral prostate implants, 4–13 are posterior peripheral prostate implants, and 14–15 are peripheral cervix implants. Blood perfusion of 2 kg/m3/s was assumed. FEM-only plan represents the standard to compare.
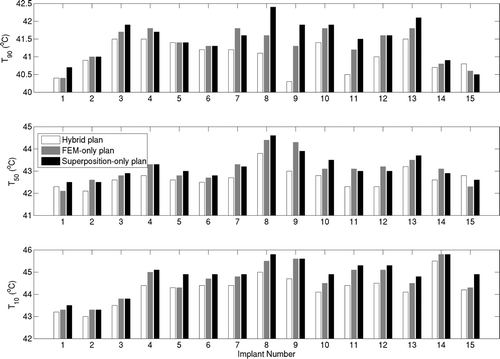
Figure 10. Comparison of optimisation-based planning performance of superposition/FEM hybrid plan (white), FEM-only plan (grey) and superposition-only plan (black) in terms of T90, T50 and T10 for all 15 implant cases. Cases 1–3 correspond to peripheral prostate implants, 4–13 are posterior peripheral prostate implants, and 14–15 are peripheral cervix implants. Blood perfusion of 2 kg/m3/s was assumed. FEM-only plan represents the standard to compare.
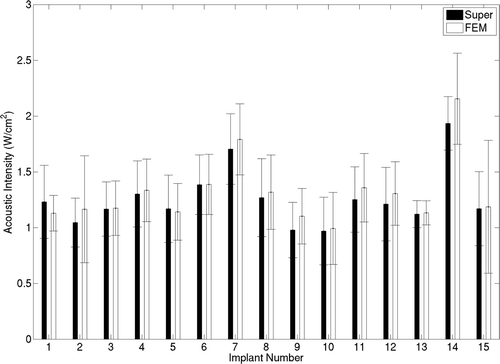
Figure 11. A comparison between transducer acoustic intensities obtained by the superposition- and FEM-based optimisation is shown for all 15 implant cases. Mean acoustic intensities obtained in example implants are shown and standard deviations are indicated by error bars.

Figure 11. A comparison between transducer acoustic intensities obtained by the superposition- and FEM-based optimisation is shown for all 15 implant cases. Mean acoustic intensities obtained in example implants are shown and standard deviations are indicated by error bars.

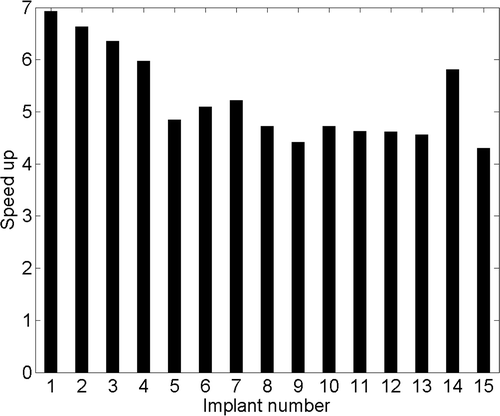
Figure 12. Optimisation speed-up was defined as the ratio of time required per iteration during FEM-based optimisation and time required per iteration during superposition-based iteration. The speed gain obtained during optimisation has been plotted for all 15 patient implants.

Figure 12. Optimisation speed-up was defined as the ratio of time required per iteration during FEM-based optimisation and time required per iteration during superposition-based iteration. The speed gain obtained during optimisation has been plotted for all 15 patient implants.

Reprints and Corporate Permissions

Please note: Selecting permissions does not provide access to the full text of the article, please see our help page How do I view content?

To request a reprint or corporate permissions for this article, please click on the relevant link below:

Academic Permissions

Please note: Selecting permissions does not provide access to the full text of the article, please see our help page How do I view content?

Obtain permissions instantly via Rightslink by clicking on the button below:

If you are unable to obtain permissions via Rightslink, please complete and submit this Permissions form. For more information, please visit our Permissions help page.