1,033
Views
12
CrossRef citations to date
0
Altmetric
Research Articles

Ultrasound-mediated gene transfection in vitro: Effect of ultrasonic parameters on efficiency and cell viability

, , , , , , , & show all
Pages 290-299 | Received 15 Nov 2011, Accepted 07 Feb 2012, Published online: 23 May 2012

Figures & data

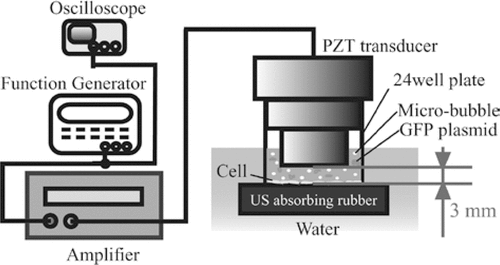
Figure 1. US exposure system.

Figure 1. US exposure system.

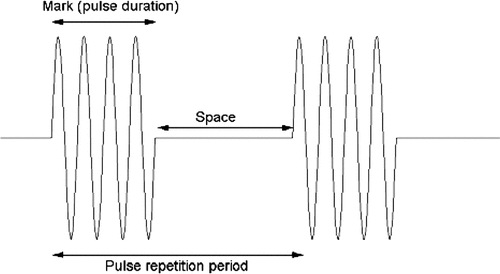
Figure 2. Burst wave characteristics.

Figure 2. Burst wave characteristics.

Figure 3. Acoustic pressure field measured with needle hydrophone. (A) Hydrophone placed 3 mm away from the transducer. Max, maximum value of signal recorded, i.e. peak positive pressure; Min, minimum value (absolute value of min is also called the peak negative value). (B) Hydrophone placed 6 mm away from the transducer. +, 24-well plate positioned between the hydrophone and the transducer; –, no 24-well plate positioned between the hydrophone and the transducer.
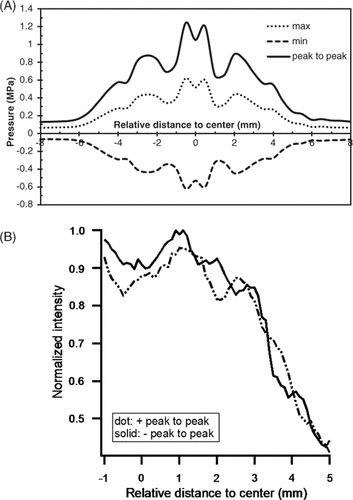
Figure 3. Acoustic pressure field measured with needle hydrophone. (A) Hydrophone placed 3 mm away from the transducer. Max, maximum value of signal recorded, i.e. peak positive pressure; Min, minimum value (absolute value of min is also called the peak negative value). (B) Hydrophone placed 6 mm away from the transducer. +, 24-well plate positioned between the hydrophone and the transducer; –, no 24-well plate positioned between the hydrophone and the transducer.

Table I.  Sonazoid® bubble density at different volume concentrations.

Figure 4. Confirmation of gene transfection rates at different bubble volume concentrations. US intensity 1.76 W/cm2, burst duty ratio 10%, pulse repetition frequency (PRF) 5 kHz, insonation time 60 s. (A) was obtained with 10% microbubble volume concentration on a fluorescent microscope. The data is averaged from three independent replicates (12 samples) and shown as the mean ± standard deviation.
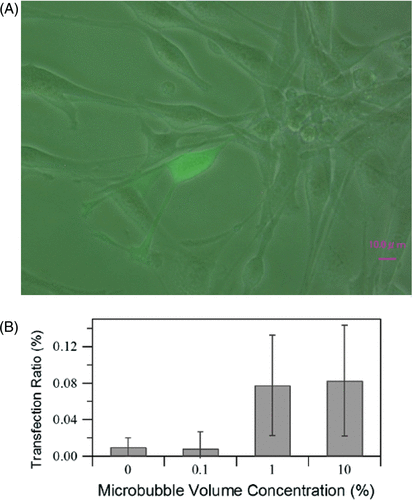
Figure 4. Confirmation of gene transfection rates at different bubble volume concentrations. US intensity 1.76 W/cm2, burst duty ratio 10%, pulse repetition frequency (PRF) 5 kHz, insonation time 60 s. (A) was obtained with 10% microbubble volume concentration on a fluorescent microscope. The data is averaged from three independent replicates (12 samples) and shown as the mean ± standard deviation.
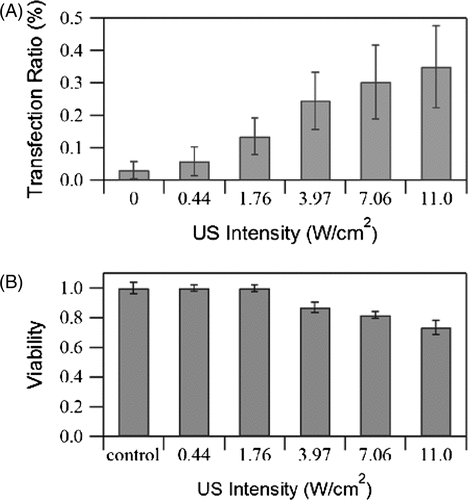
Figure 5. Effects of US intensity on (A) GFP transfection rate and (B) cell viability measured immediately after exposure. Burst duty ratio 10%, pulse repetition frequency 5 kHz, insonation time 60 s, microbubble concentration 10%. The data is averaged from three independent replicates (12 samples) and shown as the mean ± standard deviation.
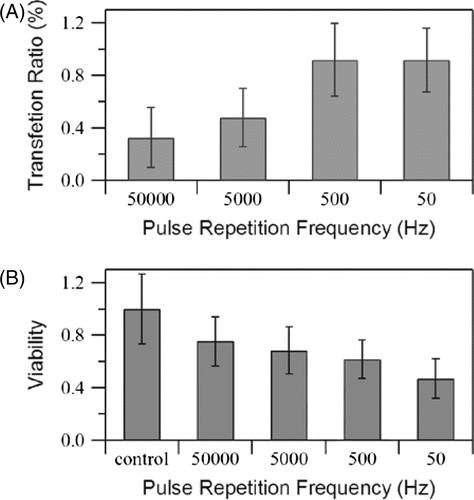
Figure 5. Effects of US intensity on (A) GFP transfection rate and (B) cell viability measured immediately after exposure. Burst duty ratio 10%, pulse repetition frequency 5 kHz, insonation time 60 s, microbubble concentration 10%. The data is averaged from three independent replicates (12 samples) and shown as the mean ± standard deviation.
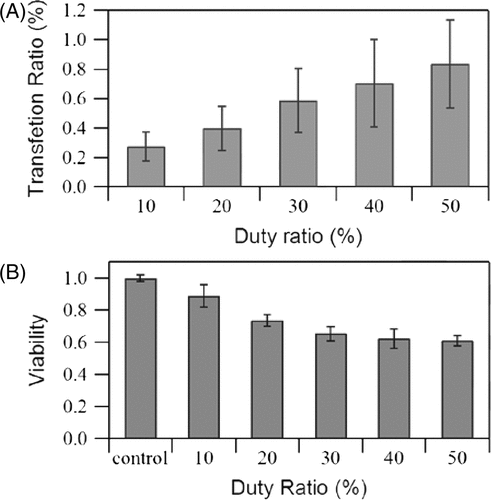
Figure 6. Effects of PRF on (A) GFP transfection rate and (B) cell viability measured immediately after US exposure. US intensity 4.94 W/cm2, burst duty ratio 10%, insonation time 60 s, microbubble concentration 10%. The data is averaged from three independent replicates (12 samples) and shown as the mean ± standard deviation.
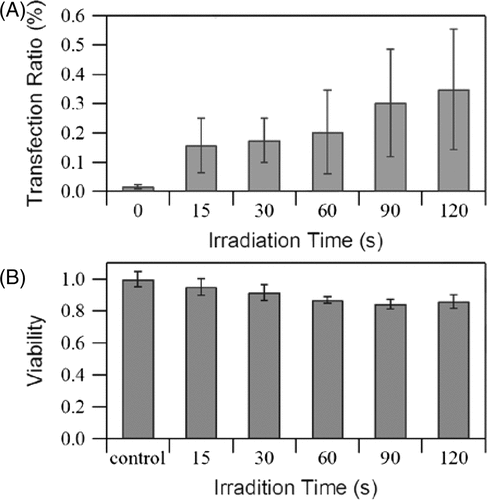
Figure 6. Effects of PRF on (A) GFP transfection rate and (B) cell viability measured immediately after US exposure. US intensity 4.94 W/cm2, burst duty ratio 10%, insonation time 60 s, microbubble concentration 10%. The data is averaged from three independent replicates (12 samples) and shown as the mean ± standard deviation.
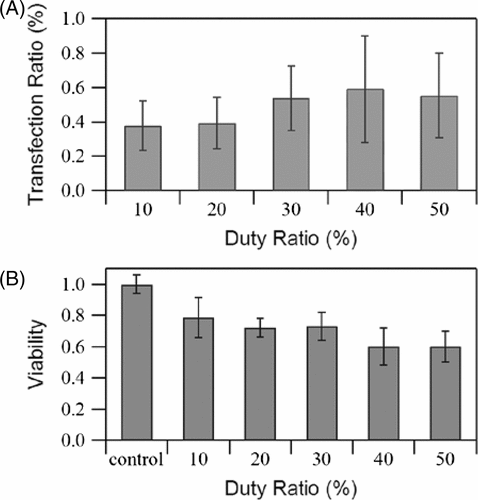
Figure 7. Effects of duty ratio on (A) GFP transfection rate and (B) cell viability measured immediately after exposure. US intensity 4.94 W/cm2, pulse repetition frequency 5 kHz, insonation time 60 s, microbubble concentration 10%. The data is averaged from three independent replicates (12 samples) and shown as the mean ± standard deviation.
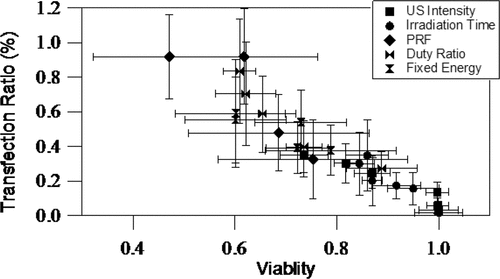
Figure 7. Effects of duty ratio on (A) GFP transfection rate and (B) cell viability measured immediately after exposure. US intensity 4.94 W/cm2, pulse repetition frequency 5 kHz, insonation time 60 s, microbubble concentration 10%. The data is averaged from three independent replicates (12 samples) and shown as the mean ± standard deviation.

Figure 8. Effects of irradiation time on (A) GFP transfection rate, and (B) cell viability measured immediately after exposure. US intensity 1.76 W/cm2, burst duty ratio 10%, pulse repetition frequency 5 kHz, microbubble concentration 10%. The data is averaged from three independent replicates (12 samples) and shown as the mean ± standard deviation.

Figure 8. Effects of irradiation time on (A) GFP transfection rate, and (B) cell viability measured immediately after exposure. US intensity 1.76 W/cm2, burst duty ratio 10%, pulse repetition frequency 5 kHz, microbubble concentration 10%. The data is averaged from three independent replicates (12 samples) and shown as the mean ± standard deviation.

Figure 9. Effects of duty ratio with fixed energy on (A) GFP transfection rate and (B) cell viability measured immediately after exposure. US intensity 4.94 W/cm2, pulse repetition frequency 5 kHz, microbubble concentration 10%. Corresponding duty ratios and insonation times are 10% 60 s, 20% 30 s, 30% 20 s, 40% 15 s, 50% 12 s. The data is averaged from three independent replicates (12 samples) and shown as the mean ± standard deviation.

Figure 9. Effects of duty ratio with fixed energy on (A) GFP transfection rate and (B) cell viability measured immediately after exposure. US intensity 4.94 W/cm2, pulse repetition frequency 5 kHz, microbubble concentration 10%. Corresponding duty ratios and insonation times are 10% 60 s, 20% 30 s, 30% 20 s, 40% 15 s, 50% 12 s. The data is averaged from three independent replicates (12 samples) and shown as the mean ± standard deviation.

Figure 10. Parametric space containing the results of all treatments. Central frequency 2 MHz, microbubble concentration 10%. The data is averaged from three independent replicates (12 samples) and shown as the mean ± standard deviation.

Figure 10. Parametric space containing the results of all treatments. Central frequency 2 MHz, microbubble concentration 10%. The data is averaged from three independent replicates (12 samples) and shown as the mean ± standard deviation.

Figure 11. Change in volume concentration of microbubbles during 60 s exposure at two intensities. Central frequency 2 MHz, initial microbubble concentration 10%. US intensity, 1.76 W/cm2 and 11 W/cm2 (dotted line for 11 W/cm2 and solid line for 1.76 W/cm2), pulse repetition frequency 5 kHz, insonation time, 60 s.
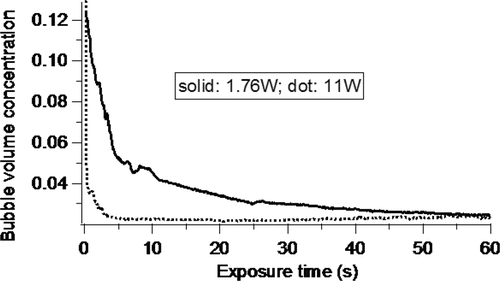
Figure 11. Change in volume concentration of microbubbles during 60 s exposure at two intensities. Central frequency 2 MHz, initial microbubble concentration 10%. US intensity, 1.76 W/cm2 and 11 W/cm2 (dotted line for 11 W/cm2 and solid line for 1.76 W/cm2), pulse repetition frequency 5 kHz, insonation time, 60 s.
Reprints and Corporate Permissions

Please note: Selecting permissions does not provide access to the full text of the article, please see our help page How do I view content?

To request a reprint or corporate permissions for this article, please click on the relevant link below:

Academic Permissions

Please note: Selecting permissions does not provide access to the full text of the article, please see our help page How do I view content?

Obtain permissions instantly via Rightslink by clicking on the button below:

If you are unable to obtain permissions via Rightslink, please complete and submit this Permissions form. For more information, please visit our Permissions help page.