Figures & data
Figure 1. (A) baseline T1w MRI images of a rat brain showing target sonication locations. (B) contrast-enhanced T1w images post FUS BBBD showing enhancement indicating disruption at the eight target locations.
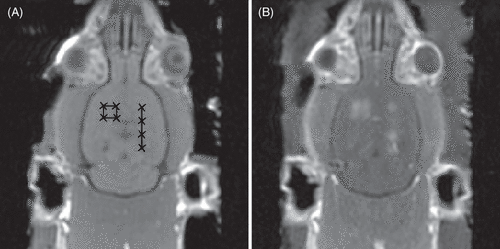
Figure 2. (A) Resonance frequency as a function of microbubble radius for free bubbles oscillating in the linear regime based on Equation 1. The polytropic constant is 1.06 in this example Citation[41]. (B) Radial bubble displacement as a function of equilibrium bubble radius for free bubbles oscillating in the linear regime under acoustic excitation at 0.5 MHz and 50 kPa peak pressure. The radial displacement was calculated based on equations for undamped linear oscillations in Citation[42] and does not account for constraints imposed by a bubble shell or the vessel wall, or for non-linear oscillations.
![Figure 2. (A) Resonance frequency as a function of microbubble radius for free bubbles oscillating in the linear regime based on Equation 1. The polytropic constant is 1.06 in this example Citation[41]. (B) Radial bubble displacement as a function of equilibrium bubble radius for free bubbles oscillating in the linear regime under acoustic excitation at 0.5 MHz and 50 kPa peak pressure. The radial displacement was calculated based on equations for undamped linear oscillations in Citation[42] and does not account for constraints imposed by a bubble shell or the vessel wall, or for non-linear oscillations.](/cms/asset/a6da5572-eec4-422f-a3c5-5b68893103bd/ihyt_a_666709_f0002_b.gif)
Table I. Therapeutic agents delivered to the brain using ultrasound.