Figures & data
Figure 1. Ultrasound equipment schematic. The sample was placed in a water bath containing an ultrasound transducer focused on the sample and an acoustic absorber to minimize standingwave formation.
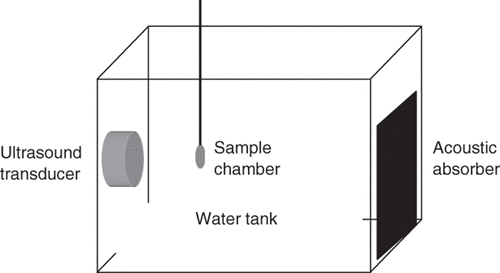
Figure 2. Representative flow cytometry density plots showing the three populations of DU145 cells after incubation for 8 h after US exposure. (a) non-sonicated control sample before sorting; (b) sonicated sample before sorting; (c) cells with DNA uptake but no GFP expression (“uptake cells”) after sorting and (d) cells with GFP expression (“transfected cells”) after sorting. Both axes have relative units. The x-axis shows GFP fluorescence, which is a measure of gene transfection. The y axis shows Cy5-labeled DNA fluorescence, which is a measure of DNA uptake.
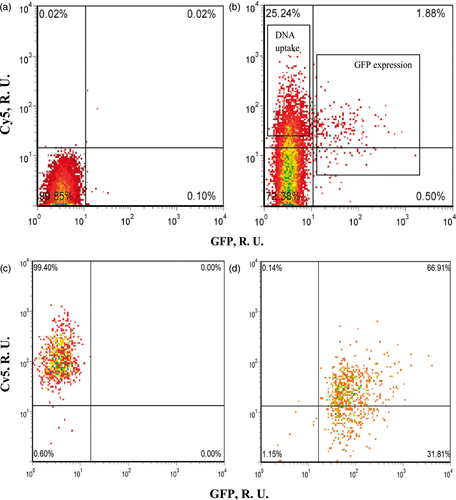
Figure 3. Gene expression analysis after US exposure. (a) The heat map of Z-scores of 78 differentially expressed genes between uptake cells and transfected cells, sorted by descending Δ Z-score. The green color indicates lower expression and the red indicates higher expression level by transfected cells relative to uptake cells. (b) The expression levels of TOP2α and GADD45α in the two cell populations were determined using qRT-PCR. Data represent the means of n = 3 replicates with standard deviation error bars (*p < 0.01). Grey bars: uptake cells. Black bars: transfected cells.
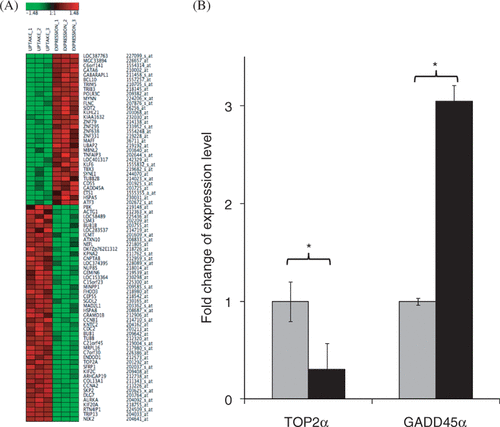
Figure 4. Cell cycle analysis of the three populations at 8 h after US exposure: cells without bioeffects (white bars), uptake cells (grey bars) and transfected cells (black bars). Data represent the averages of n ≥ 3 replicates with standard deviation error bars (*p < 0.05).
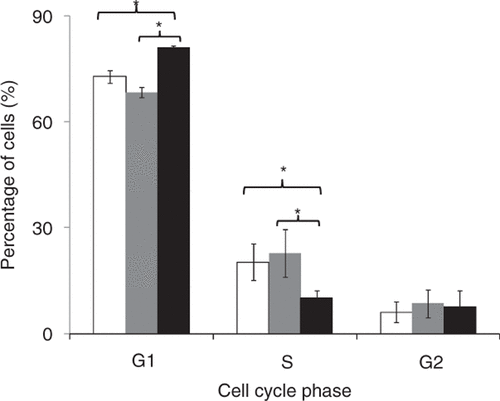
Figure 5. Effect of treatment with drugs believed to up-regulate GADD45α on gene transfection after US exposure. EMS treatment (0.6 mg/mL) and NMDA treatment (2 mM) increased transfection efficiency mediated by US. PRIMA-1 treatment (1 mM) did not affect transfection efficiency. Data represent the averages of n ≥ 3 replicates with standard deviation error bars (*paired Student's t-test, p < 0.05).
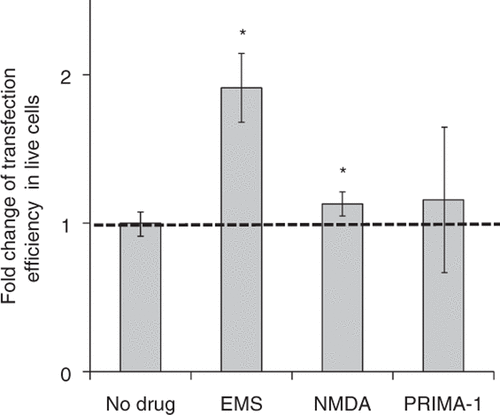
Figure 6. Effect of treatment with drugs believed to down-regulate TOP2α on gene transfection after US exposure. Amsacrine treatment (200 nM) and chloroquine treatment (100 µM) increased transfection efficiency mediated by US. Etoposide treatment (200 nM) and Mitoxantrone treatment (200 nM) did not affect transfection efficiency. Data represent the averages of n ≥ 3 replicates with standard deviation error bars (*paired Student's t-test, p < 0.05).
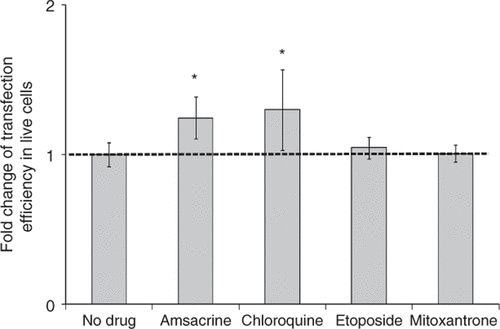
Figure 7. Effect of chloroquine on degradative vesicle trafficking in cells. A representative flow cytometry histogram showing that the geometric mean of green fluorescence among sonicated cells after LysoTracker staining of endosomes/lysosomes and autophagosomes/autophagolysosomes decreased by an average of 24% (n = 6, paired Student's t-test p = 0.01) with chloroquine treatment.
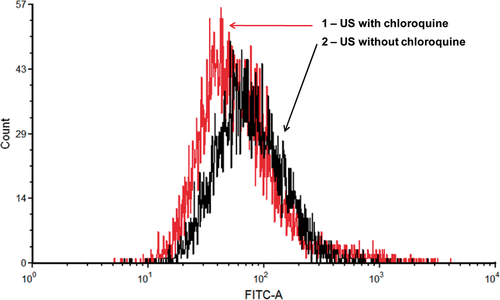
Figure 8. Effect of drug treatments on endogenous gene expression levels after US exposure. Results from qRT-PCR confirmed that treatment with EMS or NMDA increased the expression level of GADD45α (grey bars) and treatment with chloroquine or amsacrine decreased the expression level of TOP2α (black bars) relative to US exposure without drug treatment. Data represent the averages of n = 3 replicates with standard deviation error bars (*p < 0.05).
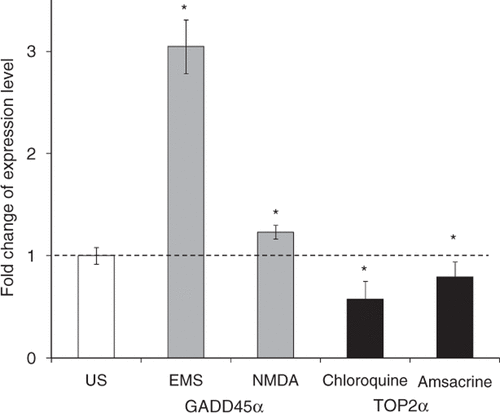
Figure 9. Effect of treatment with drugs regulating active transport and trafficking on gene transfection after US exposure. Paclitaxel treatment (16 µM) and docetaxel treatment (16 µM) increased transfection efficiency, tetracaine treatment (20 µM) decreased transfection efficiency and bafilomycin A1 (250 nM) did not change transfection efficiency. Data represent the averages of n ≥ 3 replicates with standard deviation error bars (*paired Student's t-test, p < 0.05).
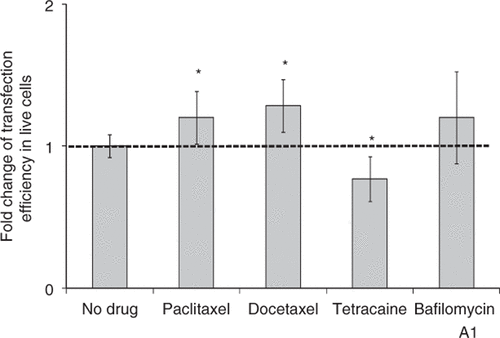
Figure 10. Fold change of US-mediated DNA uptake with and without drug treatment with EMS (0.6 mg/mL), NMDA (2 mM), amsacrine (200 nM), chloroquine (100 µM), paclitaxel (16 µM) or docetaxel (16 µM). Data represent the averages of n = 3 replicates and the error bars represent 95% confidence interval (Student's t-test, p > 0.05).
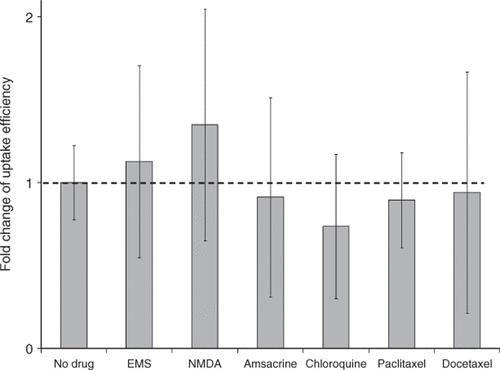
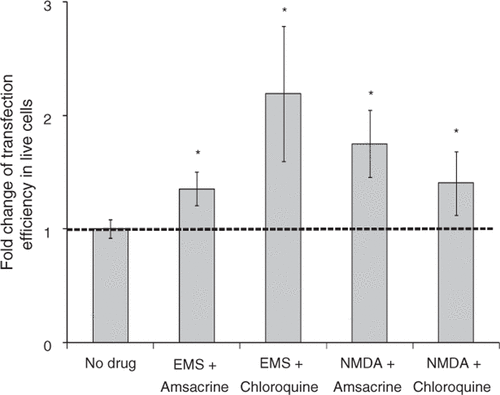
Figure 11. Effect of treatment with combinations of drugs on gene transfection after US exposure. Treatment with combinations of two drugs increased transfection efficiency mediated by US: EMS (0.6 mg/mL) and amsacrine (200 nM), EMS (0.6 mg/mL) and chloroquine (100 µM), NMDA (2 mM) and amsacrine (200 nM), NMDA (2 mM) and chloroquine (100 µM). Data represent the averages of n ≥ 3 replicates with standard deviation (*paired Student's t-test, p < 0.05).