602
Views
18
CrossRef citations to date
0
Altmetric
RESEARCH ARTICLE

A pilot study for clinical feasibility of the near-harmonic 2D referenceless PRFS thermometry in liver under free breathing using MR-guided LITT ablation data

, , , , , , & show all
Pages 250-266 | Received 16 Dec 2011, Accepted 24 Feb 2012, Published online: 19 Apr 2012

Figures & data

Figure 1. Steps of numerical calculation of the referenceless temperature map. The inner border of the Dirichlet's domain is shown. To determine on-the-fly the average curvature of the 2D phase map, a double border is required (3-pixel total width).
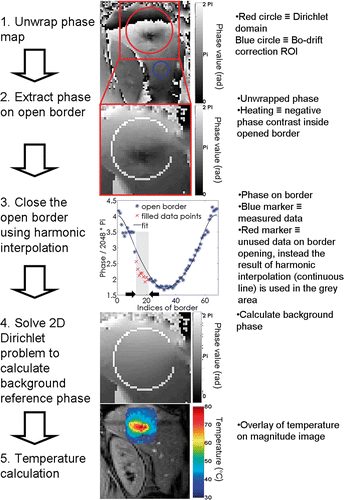
Figure 1. Steps of numerical calculation of the referenceless temperature map. The inner border of the Dirichlet's domain is shown. To determine on-the-fly the average curvature of the 2D phase map, a double border is required (3-pixel total width).

Table I.  Overview of clinical data for the patients included in the study. A typical duration of fibre placement was 20 min per fibre and the effective ablation for each patient was about 20 min.

Figure 2. Open border with one open segment defined using two parameters: a starting angle α, and the ratio of the segment length to the circle perimeter. For a given calculation, the same parameters were used both for the inner and outer border of Dirichlet's domain.
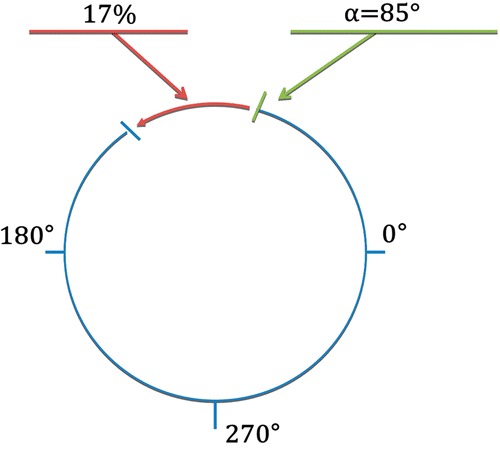
Figure 2. Open border with one open segment defined using two parameters: a starting angle α, and the ratio of the segment length to the circle perimeter. For a given calculation, the same parameters were used both for the inner and outer border of Dirichlet's domain.

Figure 3. Illustration of pixel-wise calculation of laser-induced temperature elevation over time in the liver of patient 5. The upper frame (A) shows directly calculated values, while the lower frame (B) shows the corresponding expanding window regularised temperature data. Continuous lines are the end-point fitted curves. The reference phase subtraction and the referenceless calculation are both processed. Also, the residues between sampling point data and the end-point fitted curve are plotted below each frame. Note that the regularisation model is constrained to start at 37.2°C with horizontal tangent.
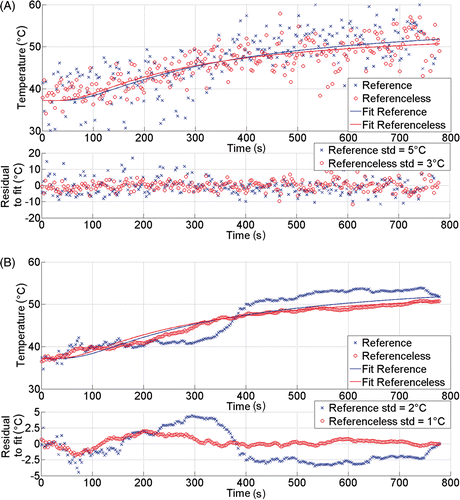
Figure 3. Illustration of pixel-wise calculation of laser-induced temperature elevation over time in the liver of patient 5. The upper frame (A) shows directly calculated values, while the lower frame (B) shows the corresponding expanding window regularised temperature data. Continuous lines are the end-point fitted curves. The reference phase subtraction and the referenceless calculation are both processed. Also, the residues between sampling point data and the end-point fitted curve are plotted below each frame. Note that the regularisation model is constrained to start at 37.2°C with horizontal tangent.

Table II.  Overview of MRT baseline stability (non-heated ROI). No temporal regularisation was performed. All data was averaged over the ROIs in all four slices. Theoretical SDT was calculated based on Equation 5.

Figure 4. Comparison of seven consecutive acquisitions under free breathing of a sagittal plane in patient liver at two different stages of the in-progress laser ablation in patient 2: (A) temporal window approximately 4 min from starting the procedure; (B) temporal window after approximately 7 min from starting the procedure. Referenceless and reference phase subtraction MRT (shown FOV = 70 mm, relative values from baseline) and corresponding magnitude images (shown FOV = 200 mm) are presented together. Calculated relative values of temperature below − 10°C are displayed with dark blue. The circular contour overlaid on magnitude images is the inner border of the Dirichlet's domain (optionally opened). The last magnitude image of each series corresponds to the reference scan. Before laser energy is applied, the optical fibre tip is not visible in the magnitude images. A linear colour code has been used for the temperature elevation above the physiological baseline of 37.2°C.
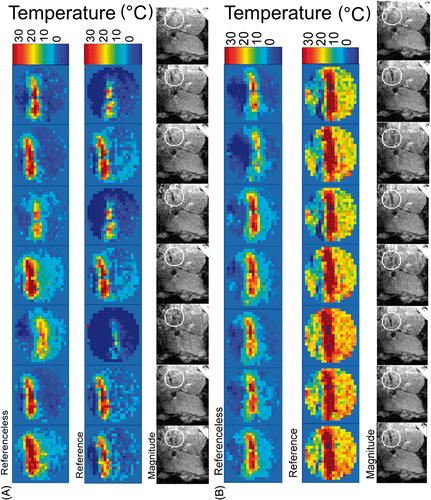
Figure 4. Comparison of seven consecutive acquisitions under free breathing of a sagittal plane in patient liver at two different stages of the in-progress laser ablation in patient 2: (A) temporal window approximately 4 min from starting the procedure; (B) temporal window after approximately 7 min from starting the procedure. Referenceless and reference phase subtraction MRT (shown FOV = 70 mm, relative values from baseline) and corresponding magnitude images (shown FOV = 200 mm) are presented together. Calculated relative values of temperature below − 10°C are displayed with dark blue. The circular contour overlaid on magnitude images is the inner border of the Dirichlet's domain (optionally opened). The last magnitude image of each series corresponds to the reference scan. Before laser energy is applied, the optical fibre tip is not visible in the magnitude images. A linear colour code has been used for the temperature elevation above the physiological baseline of 37.2°C.

Table III.  Overview of model-based temporal regularisation of temperature data in the heated ROI, for the respiratory-triggered MRT acquisition sequence. All values were averaged over the ROIs in the four slices.

Table IV.  Spatial correlation between the size of the unperfused region (24 h post-treatment) and the predicted ablation (240CEM43) from regularised reference-less thermometry data.

Figure 5. (A) Visual comparison between thermal dose 240CEM43 threshold and the Gd-uptake 24 h follow-up. Contrast enhanced FLASH 2D magnitude images acquired 24 h after intervention are shown. They are overlaid by the threshold border of the lethal thermal dose. (B) Bland and Altman graphics for the same data.
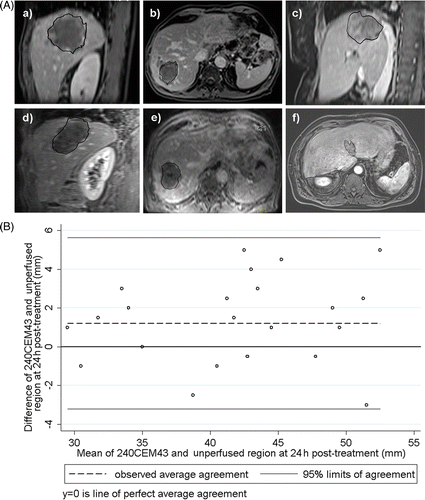
Figure 5. (A) Visual comparison between thermal dose 240CEM43 threshold and the Gd-uptake 24 h follow-up. Contrast enhanced FLASH 2D magnitude images acquired 24 h after intervention are shown. They are overlaid by the threshold border of the lethal thermal dose. (B) Bland and Altman graphics for the same data.

Figure 6. Ex vivo simulator of breathing motion during MRgHIFU therapy. An inflating balloon (1) is driven by a mechanical ventilator and induces motion of the ex vivo specimen (3). The HIFU transducer (2) is positioned by means of a 2D piezoelectric motorised system (4). The air flow into the balloon is indicated by the black arrow.
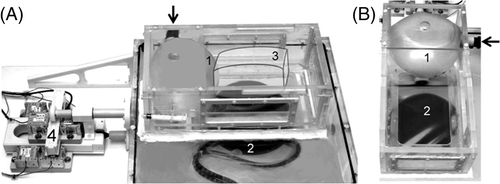
Figure 6. Ex vivo simulator of breathing motion during MRgHIFU therapy. An inflating balloon (1) is driven by a mechanical ventilator and induces motion of the ex vivo specimen (3). The HIFU transducer (2) is positioned by means of a 2D piezoelectric motorised system (4). The air flow into the balloon is indicated by the black arrow.

Figure 7. Ex vivo moving phantom comparison between reference phase subtraction PRFS thermometry (Bo-drift corrected) and the reference-less calculation using the near-harmonic reconstruction of the background phase. Results are shown for an interleaved double focus HIFU sonication of 40 s (50%–50% duty cycle, 6 mm gap along LR direction, 500 ms repetition time). The imaging plane was orthogonal to the HIFU beam axis (shown FOV is 41 mm square). The set-up shown in has been used, adjusting the ventilation period at 7.5 s. The implementation of the reference-free calculation used a closed circular border of inner radius 16 pixels (16 mm). (A) coronal temperature change maps after 24 s of sonication, inflated balloon state; (B) coronal temperature change maps after 27.4 s of sonication, deflated balloon state; (C) colour coded 1D profile of temperature change through one focal spot (see dotted line in frames A and B), scrolled over time. The temperature change colour bars are gridded in °C; (D) plot of the calculated temperature with time for the two MR thermometry methods in the same unheated voxel; note the periodic large error of standard PRFS calculation and the stable baseline for the reference-free method.
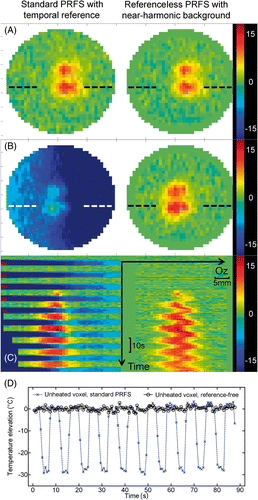
Figure 7. Ex vivo moving phantom comparison between reference phase subtraction PRFS thermometry (Bo-drift corrected) and the reference-less calculation using the near-harmonic reconstruction of the background phase. Results are shown for an interleaved double focus HIFU sonication of 40 s (50%–50% duty cycle, 6 mm gap along LR direction, 500 ms repetition time). The imaging plane was orthogonal to the HIFU beam axis (shown FOV is 41 mm square). The set-up shown in Figure 3 has been used, adjusting the ventilation period at 7.5 s. The implementation of the reference-free calculation used a closed circular border of inner radius 16 pixels (16 mm). (A) coronal temperature change maps after 24 s of sonication, inflated balloon state; (B) coronal temperature change maps after 27.4 s of sonication, deflated balloon state; (C) colour coded 1D profile of temperature change through one focal spot (see dotted line in frames A and B), scrolled over time. The temperature change colour bars are gridded in °C; (D) plot of the calculated temperature with time for the two MR thermometry methods in the same unheated voxel; note the periodic large error of standard PRFS calculation and the stable baseline for the reference-free method.

Reprints and Corporate Permissions

Please note: Selecting permissions does not provide access to the full text of the article, please see our help page How do I view content?

To request a reprint or corporate permissions for this article, please click on the relevant link below:

Academic Permissions

Please note: Selecting permissions does not provide access to the full text of the article, please see our help page How do I view content?

Obtain permissions instantly via Rightslink by clicking on the button below:

If you are unable to obtain permissions via Rightslink, please complete and submit this Permissions form. For more information, please visit our Permissions help page.