2,616
Views
113
CrossRef citations to date
0
Altmetric
Research Articles

Targeted drug delivery by high intensity focused ultrasound mediated hyperthermia combined with temperature-sensitive liposomes: Computational modelling and preliminary in vivovalidation

, , , , , & show all
Pages 337-348 | Received 21 Nov 2011, Accepted 16 Mar 2012, Published online: 23 May 2012

Figures & data

Table 1.  Parameters of the HIFU heat transfer model.

Figure 1. Drug delivery model overview. After TSL are exposed to hyperthermia, drug is released at the target site at a rate depending on local temperature. Released drug can cross the vessel wall into the EES, where drug diffuses and intracellular uptake takes place. Drug not taken up by tissue is removed from the tumour plasma by blood perfusion (Figure reproduced from Gasselhuber et al. Citation[16]).

Figure 1. Drug delivery model overview. After TSL are exposed to hyperthermia, drug is released at the target site at a rate depending on local temperature. Released drug can cross the vessel wall into the EES, where drug diffuses and intracellular uptake takes place. Drug not taken up by tissue is removed from the tumour plasma by blood perfusion (Figure reproduced from Gasselhuber et al. Citation[16]).

Table 2.  Parameters for the drug delivery model.

Figure 2. Computer model results in plane parallel to the HIFU beam path (transducer position illustrated at bottom) shown for hyperthermia (HT) regimen (target temperature 43°C). (A) Temperature map at the end of 30 min heating (left), corresponding perfusion map (right). (B) Intracellular DOX concentration 35 min after initiation of HIFU (left), and resulting cell survival due to cellular DOX uptake (right). White arrow in (A) indicates location corresponding to plots and the white dashed line indicates the plane parallel to transducer, corresponding to results in .
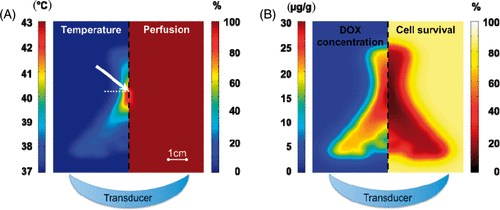
Figure 2. Computer model results in plane parallel to the HIFU beam path (transducer position illustrated at bottom) shown for hyperthermia (HT) regimen (target temperature 43°C). (A) Temperature map at the end of 30 min heating (left), corresponding perfusion map (right). (B) Intracellular DOX concentration 35 min after initiation of HIFU (left), and resulting cell survival due to cellular DOX uptake (right). White arrow in (A) indicates location corresponding to Figure 3 plots and the white dashed line indicates the plane parallel to transducer, corresponding to results in Figure 5.

Figure 3. (A) Temperature and perfusion time course for HT case, and (B) corresponding concentrations of TSL-DOX, and bioavailable DOX in plasma, EES and cells. (C) Temperature and perfusion time course for the HT+ case, and (D) corresponding DOX concentrations in tumour compartments. All data are shown at the location of highest temperature (white arrow in ).
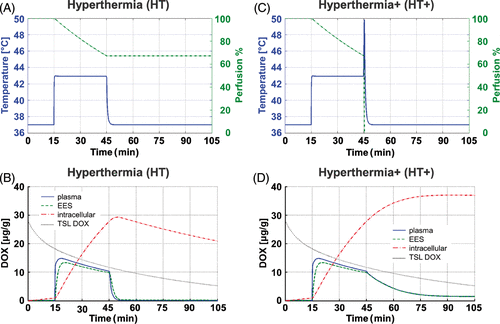
Figure 3. (A) Temperature and perfusion time course for HT case, and (B) corresponding concentrations of TSL-DOX, and bioavailable DOX in plasma, EES and cells. (C) Temperature and perfusion time course for the HT+ case, and (D) corresponding DOX concentrations in tumour compartments. All data are shown at the location of highest temperature (white arrow in Figure 2A).

Figure 4. Effect of hyperthermia exposure duration on drug uptake, assuming a constant temperature of 43°C after t = 15 min. TSL-DOX concentration decreases due to limited TSL stability in plasma. Maximum intracellular DOX concentration was reached after ∼2 h of hyperthermia, and limited by TSL-DOX plasma half-life.
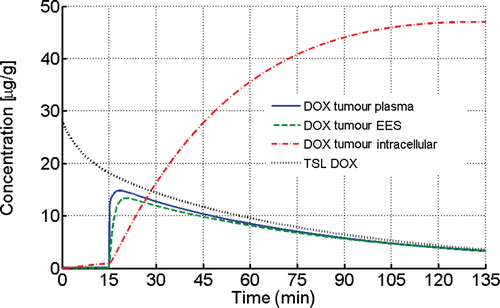
Figure 4. Effect of hyperthermia exposure duration on drug uptake, assuming a constant temperature of 43°C after t = 15 min. TSL-DOX concentration decreases due to limited TSL stability in plasma. Maximum intracellular DOX concentration was reached after ∼2 h of hyperthermia, and limited by TSL-DOX plasma half-life.

Figure 5. (A) Temperature map during HT measured via MR Thermometry, overlaid on pre-procedural proton density-weighted coronal image of rabbit thigh muscle. (B) Radial temperature profile (time-averaged over HT duration) from in vivo study (blue), compared to model (red). Profile location in model was chosen such that it traversed maximum temperature point (see , white dashed line). Temperature deviation between simulation and in vivo study was 0.54°C (mean over 15 mm radius). (C) DOX distribution measured via fluorescence microscopy in extracted tissue sample. (D) DOX fluorescence profile (blue) in two orthogonal directions (dashed lines marked (1) and (2) in (C), compared to DOX concentration profile from computer model (red). Mean temperature map (time-averaged over HT duration) is shown for the in vivo experiment (E), and the modelling study (F). All results are shown in the plane perpendicular to the HIFU beam path (see dashed line in ).
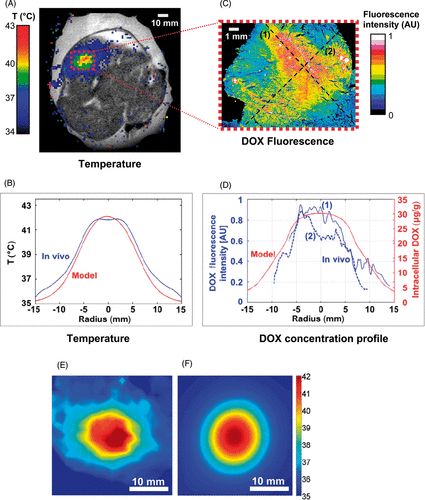
Figure 5. (A) Temperature map during HT measured via MR Thermometry, overlaid on pre-procedural proton density-weighted coronal image of rabbit thigh muscle. (B) Radial temperature profile (time-averaged over HT duration) from in vivo study (blue), compared to model (red). Profile location in model was chosen such that it traversed maximum temperature point (see Figure 2A, white dashed line). Temperature deviation between simulation and in vivo study was 0.54°C (mean over 15 mm radius). (C) DOX distribution measured via fluorescence microscopy in extracted tissue sample. (D) DOX fluorescence profile (blue) in two orthogonal directions (dashed lines marked (1) and (2) in (C), compared to DOX concentration profile from computer model (red). Mean temperature map (time-averaged over HT duration) is shown for the in vivo experiment (E), and the modelling study (F). All results are shown in the plane perpendicular to the HIFU beam path (see dashed line in Figure 2A).

Reprints and Corporate Permissions

Please note: Selecting permissions does not provide access to the full text of the article, please see our help page How do I view content?

To request a reprint or corporate permissions for this article, please click on the relevant link below:

Academic Permissions

Please note: Selecting permissions does not provide access to the full text of the article, please see our help page How do I view content?

Obtain permissions instantly via Rightslink by clicking on the button below:

If you are unable to obtain permissions via Rightslink, please complete and submit this Permissions form. For more information, please visit our Permissions help page.