644
Views
9
CrossRef citations to date
0
Altmetric
Research Article

High intensity focused ultrasound treatment for patients with advanced pancreatic cancer: A preliminary dosimetric analysis

, , , , , & show all
Pages 645-652 | Received 12 Mar 2012, Accepted 14 Jul 2012, Published online: 04 Sep 2012

Figures & data

Table I.  Clinical data for 136 cases.

Table II.  Statistical data for the treatment parameters.

Figure 1. Illustration of greyscale changes induced by HIFU. (A) No change. (B) Punctiform change. (C) Lumpish change. (D) Lumpish hyper-echo change.
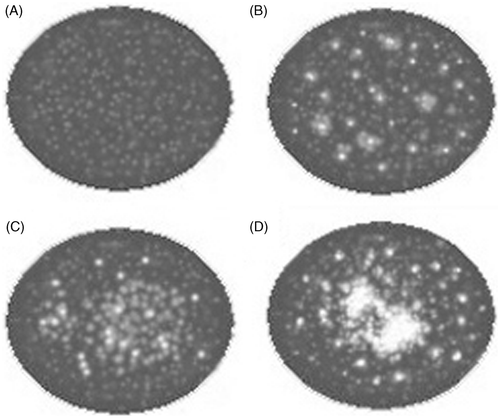
Figure 1. Illustration of greyscale changes induced by HIFU. (A) No change. (B) Punctiform change. (C) Lumpish change. (D) Lumpish hyper-echo change.

Figure 2. (A) An example of no change, US image obtained before HIFU (A1) and US image obtained after HIFU (A2), Pavg was 183 W and DI was 6.1 kJ/cm3. (B) An example of punctiform change, US image obtained before HIFU (B1) and US image obtained after HIFU (B2), Pavg was 217 W and DI was 8.8 kJ/cm3. (C) An example of lumpish change, US image obtained before HIFU (C1) and US image obtained after HIFU (C2), Pavg was 292 W and DI was 14.6 kJ/cm3. (D) An example of lumpish hyper-echo change, US image obtained before HIFU (D1) and US image obtained after HIFU (D2), Pavg was 275 W and DI was 11.3 kJ/cm3.
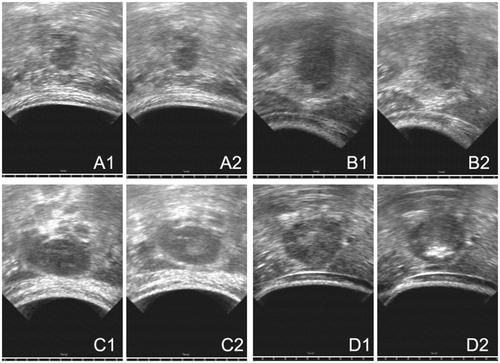
Figure 2. (A) An example of no change, US image obtained before HIFU (A1) and US image obtained after HIFU (A2), Pavg was 183 W and DI was 6.1 kJ/cm3. (B) An example of punctiform change, US image obtained before HIFU (B1) and US image obtained after HIFU (B2), Pavg was 217 W and DI was 8.8 kJ/cm3. (C) An example of lumpish change, US image obtained before HIFU (C1) and US image obtained after HIFU (C2), Pavg was 292 W and DI was 14.6 kJ/cm3. (D) An example of lumpish hyper-echo change, US image obtained before HIFU (D1) and US image obtained after HIFU (D2), Pavg was 275 W and DI was 11.3 kJ/cm3.

Figure 3. (A) MRI scan made before HIFU treatment which demonstrates a tumour in the body of the pancreas. (B) MRI scan demonstrating a vertebral injury (arrow) after HIFU treatment. Pavg of HIFU for this case was 208 W and DI was 6.9 kJ/cm3.
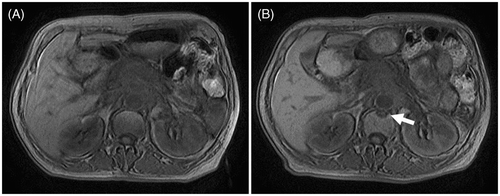
Figure 3. (A) MRI scan made before HIFU treatment which demonstrates a tumour in the body of the pancreas. (B) MRI scan demonstrating a vertebral injury (arrow) after HIFU treatment. Pavg of HIFU for this case was 208 W and DI was 6.9 kJ/cm3.

Figure 4. (A) Greyscale changes of HIFU obtained from real-time ultrasound (US) images during the HIFU procedure. (A1) US image obtained before HIFU showing a large pancreatic carcinoma lesion present in the body of pancreas. (A2) US images obtained immediately after the HIFU procedure showing a lumpish change (arrow) in one slice of the lesion. (B1) A CT scan made before HIFU demonstrating a tumour in the body of pancreas. (B2) A CT scan representing no significant size change one month after HIFU treatment and the necrotic area having the same greyscale change shown by US. (C1, D1) A PET-CT scan made before HIFU demonstrating a SUVmax of 7.8 g/mL. (C2, D2) The PET-CT scan made 1 month after HIFU showing coagulation necrosis of the tumour and a decrease in the SUVmax value to 3.5 g/mL. All images were taken from the same patient. The Pavg of HIFU for this patient was 237 W and DI was 9.9 kJ/cm3.
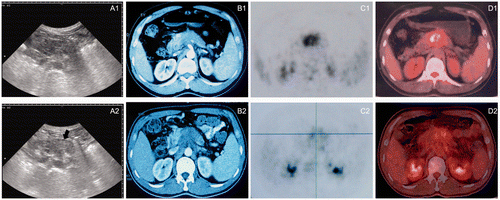
Figure 4. (A) Greyscale changes of HIFU obtained from real-time ultrasound (US) images during the HIFU procedure. (A1) US image obtained before HIFU showing a large pancreatic carcinoma lesion present in the body of pancreas. (A2) US images obtained immediately after the HIFU procedure showing a lumpish change (arrow) in one slice of the lesion. (B1) A CT scan made before HIFU demonstrating a tumour in the body of pancreas. (B2) A CT scan representing no significant size change one month after HIFU treatment and the necrotic area having the same greyscale change shown by US. (C1, D1) A PET-CT scan made before HIFU demonstrating a SUVmax of 7.8 g/mL. (C2, D2) The PET-CT scan made 1 month after HIFU showing coagulation necrosis of the tumour and a decrease in the SUVmax value to 3.5 g/mL. All images were taken from the same patient. The Pavg of HIFU for this patient was 237 W and DI was 9.9 kJ/cm3.

Figure 5. Changes in the mean DI for groups with different ultrasound image changes. The DI was significantly different (P < 0.01) between the echo change of the lumpish group (11.4 ± 4.9 kJ/cm3) and change of the non-lumpish group (7.8 ± 3.1 kJ/cm3).
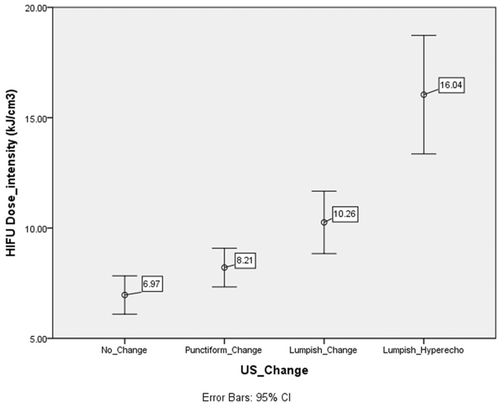
Figure 5. Changes in the mean DI for groups with different ultrasound image changes. The DI was significantly different (P < 0.01) between the echo change of the lumpish group (11.4 ± 4.9 kJ/cm3) and change of the non-lumpish group (7.8 ± 3.1 kJ/cm3).

Figure 6. Changes in the mean Pavg for groups with different ultrasound image changes. The Pavg was significantly different (P < 0.01) between the echo change of lumpish group (263 ± 54 W) and the change of the non-lumpish group (217 ± 49 W).
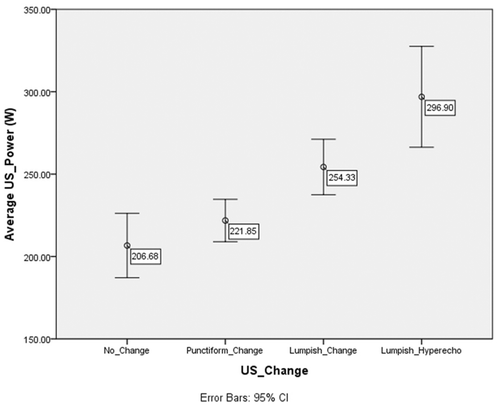
Figure 6. Changes in the mean Pavg for groups with different ultrasound image changes. The Pavg was significantly different (P < 0.01) between the echo change of lumpish group (263 ± 54 W) and the change of the non-lumpish group (217 ± 49 W).

Table III.  Spearman correlation table.

Reprints and Corporate Permissions

Please note: Selecting permissions does not provide access to the full text of the article, please see our help page How do I view content?

To request a reprint or corporate permissions for this article, please click on the relevant link below:

Academic Permissions

Please note: Selecting permissions does not provide access to the full text of the article, please see our help page How do I view content?

Obtain permissions instantly via Rightslink by clicking on the button below:

If you are unable to obtain permissions via Rightslink, please complete and submit this Permissions form. For more information, please visit our Permissions help page.