Figures & data
Figure 1. Examples of target flowers and non-target stimuli (faces and tables) in the upright and inverted orientations.
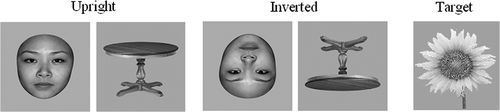
Figure 2. The diagrammatic drawing of peak amplitudes and latencies for P1 and N170, which were automatically measured between 70 ms and 120 ms and between 120 ms and 200 ms, respectively.
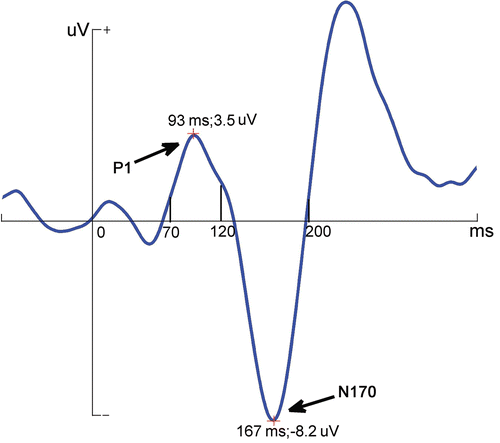
Figure 3. (A) The grand-averaged waveforms elicited by face and table stimuli before and after 1 h exposure in the heat and control groups, respectively. (B) Grand-averaged ERP topography elicited by upright faces and tables at the analysed sites for control and hyperthermia participants after exposure.
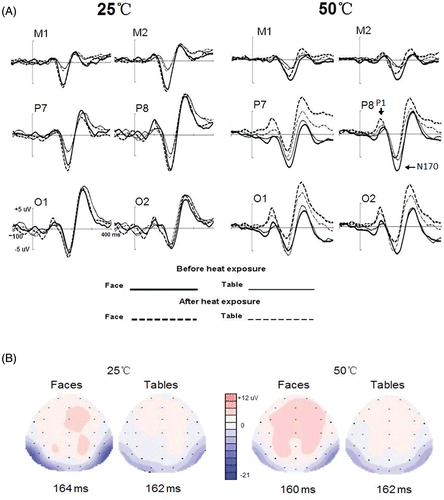
Figure 4. The grand-averaged waveforms elicited by upright and inverted face stimuli before and after 1 h exposure in the heat and control groups, respectively.
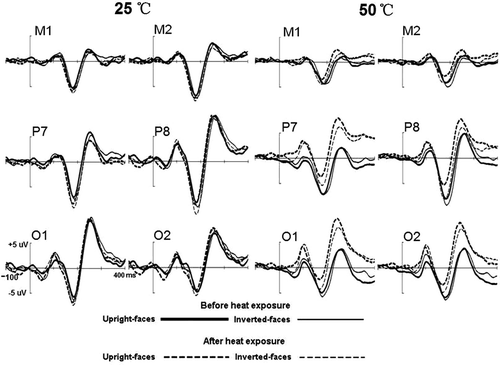
Table 1. The detailed latency (ms) and amplitude (uV) of P1 in the control group under pre-test conditions.
Table 2. The detailed latency (ms) and amplitude (uV) of P1 in the control group under post-test conditions.
Table 3. The detailed latency (ms) and amplitude (uV) of N170 in the control group under pre-test conditions.
Table 4. The detailed latency (ms) and amplitude (uV) of N170 in the control group under post-test conditions.
Table 5. The detailed latency (ms) and amplitude (uV) of P1 in the hyperthermia group under pre-test conditions.
Table 6. The detailed latency (ms) and amplitude (uV) of P1 in the hyperthermia group under post-test conditions.
Table 7. The detailed latency (ms) and amplitude (uV) of N170 in the hyperthermia group under pre-test conditions.
Table 8. The detailed latency (ms) and amplitude (uV) of N170 in the hyperthermia group under post-test conditions.