Figures & data
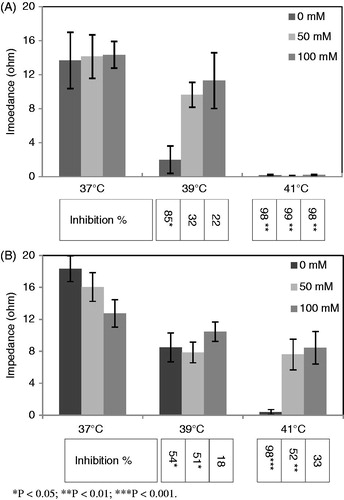
Figure 1. The graphs present the result (Ω) of impedance aggregometry on PRP samples, after stimulation of platelets with (A) 10 mM epinephrine and (B) 10 mM ADP. The levels of inhibition induced by hyperthermia treatments have been expressed in percentage inhibition below the associated columns. The results from graphs A and B indicate that maximum hyperthermia-induced inhibition occurred for the samples treated without exogenous urea (0 mM). Decreasing levels of inhibitions resulted for the samples incubated in the presence of urea. Data shown are from three runs of experiments in triplicate determinations using PRP samples obtained from three different donors (n = 9).