Figures & data
Figure 1. Configuration of the computer simulation model.
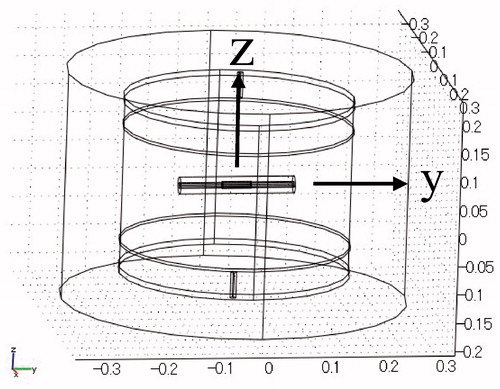
Table 1. Electrical and thermal characteristics of blood, muscle and air.
Figure 2. Control model when a stent is not inserted. The entire heated substance is defined as muscle. (A) Cross-sectional view of the model at x = 0 cm. (B) Temperature distribution after heating for 20 min. (C) Temperature profiles on the red line shown in . Each curve is the temperature profile at the heating time (min) indicated in the insert on the right. (D) Extrusion plot of temperature distribution on the red line shown in . Horizontal axis indicates the heating time in min. Maximum SAR 34 W/kg; maximum temperature 45.4 °C.
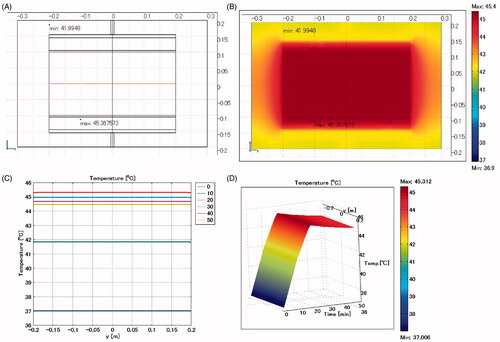
Figure 3. Biliary duct stent placed in horizontal direction. Lumen: vessel. (A) Cross-sectional view of the model at x = 0 cm. (B) Temperature distribution after heating for 20 min. (C) Temperature profiles on the red line shown in . The broken line is the control, which indicates the temperature profile after heating for 20 min shown in . (D) Extrusion plot of temperature distribution on the red line shown in . Maximum SAR 328 W/kg; maximum temperature 45.6 °C.
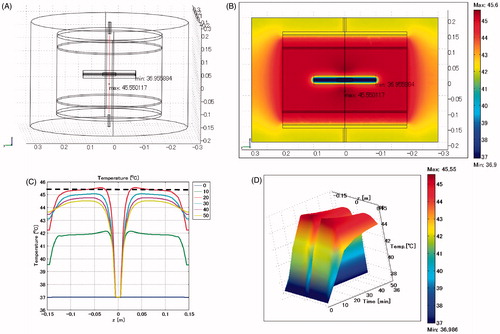
Figure 4. Biliary duct stent placed in horizontal direction. Lumen: muscle. (A) Cross-sectional view of the model at x = 0 cm. (B) Temperature distribution after heating for 20 min. (C) Temperature profile on the red line shown in . The broken line is the control, which indicates the temperature profiles after heating for 20 min shown in . (D) Extrusion plot of temperature distribution on the red line shown in . Maximum SAR 392 W/kg; maximum temperature 46.2 °C.
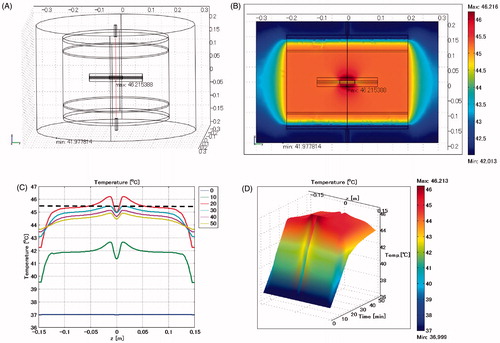
Figure 5. Biliary duct stent placed in horizontal direction. Lumen: air. (A) Cross-sectional view of the model at x = 0 cm. (B) Temperature distribution after heating for 20 min. (C) Temperature profiles on the red line shown in . (D) Extrusion plot of temperature distribution on the red line shown in . Maximum SAR 649 W/kg; maximum temperature 46.9 °C.
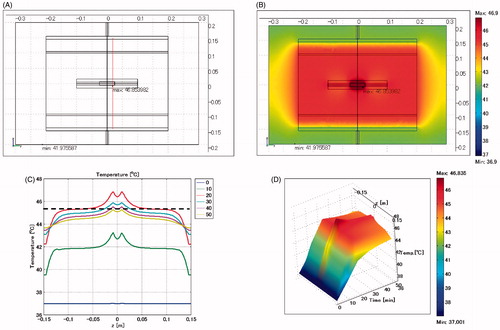
Figure 6. Biliary duct stent placed in vertical direction. Lumen: vessel. (A) Cross-sectional view of the model at x = 0 cm. (B) Temperature distribution after heating for 20 min. (C) Temperature profiles on the red line shown in . (D) Extrusion plot of temperature distribution on the red line shown in . Maximum SAR 2027 W/kg; maximum temperature 45.7 °C.
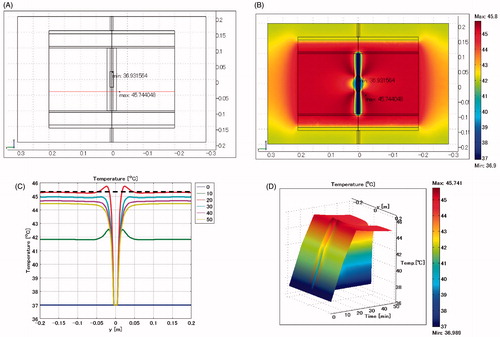
Figure 7. Biliary duct stent placed in vertical direction. Lumen: air. (A) Cross-sectional view of the model at x = 0 cm. (B) Temperature distribution after heating for 20 min. (C) Temperature profile on the red line shown in . (D) Extrusion plot of temperature distribution on the red line shown in . Maximum SAR 2525 W/kg; maximum temperature 55.2 °C.
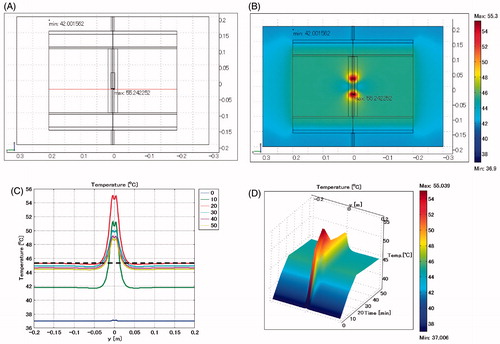
Figure 8. Biliary duct stent placed in vertical direction. Length: 10 cm. Lumen: air. (A) Cross-sectional view of the model at x = 0 cm. (B) Temperature distribution after heating for 20 min. (C) Temperature profiles on the red line shown in . (D) Extrusion plot of temperature distribution on the red line shown in . Maximum SAR 5557 W/kg; maximum temperature 80.4 °C.
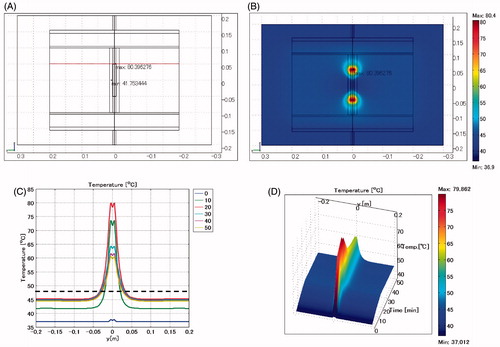
Table 2. Excessive temperature rise when placing a biliary duct stent in the muscle and heating under various conditions.
Figure 9. Oesophageal stent placed in horizontal direction. Lumen: vessel. (A) Cross-sectional view of the model at x = 0 cm. (B) Temperature distribution after heating for 20 min. (C) Temperature profiles on the red line shown in . (D) Extrusion plot of temperature distribution on the red line shown in . Maximum SAR 433 W/kg; maximum temperature 46.4 °C.
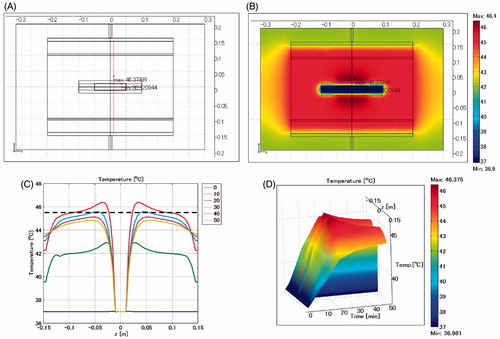
Figure 10. Oesophageal stent placed in horizontal direction. Lumen: air. (A) Cross-sectional view of the model at x = 0 cm. B: Temperature distribution after heating for 20 min. (C) Temperature profiles on the red line shown in . (D) Extrusion plot of temperature distribution on the red line shown in . Maximum SAR 950 W/kg, maximum temperature 49.1 °C.
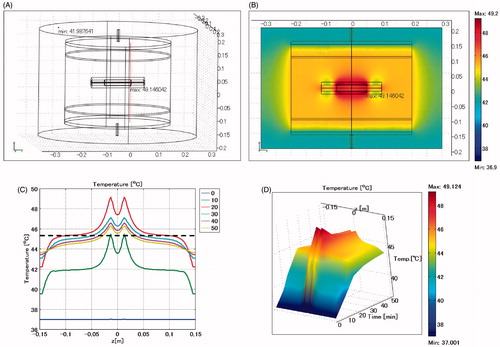
Figure 11. Oesophageal stent. Difference of levels: 4 cm. Lumen: vessel. (A) Cross-sectional view of the model at x = 0 cm. (B) Temperature distribution after heating for 20 min. (C) Temperature profiles on the red line shown in . (D) Extrusion plot of temperature distribution on the red line shown in . Maximum SAR 1576 W/kg, maximum temperature 50.4 °C.
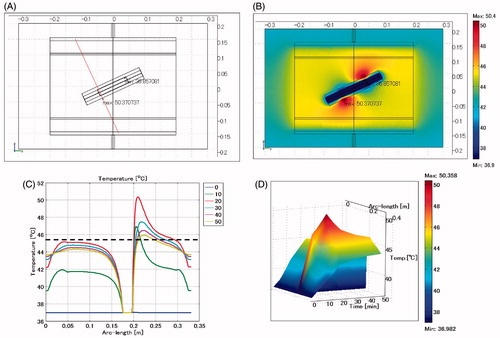
Figure 12. Oesophageal stent. Difference of levels: 4 cm. Lumen: air. (A) Cross-sectional view of the model at x = 0 cm. (B) Temperature distribution after heating for 20 min. (C) Temperature profile on the red line shown in . (D) Extrusion plot of temperature distribution on the red line shown in . Maximum SAR 2678 W/kg, maximum temperature 62.7 °C.
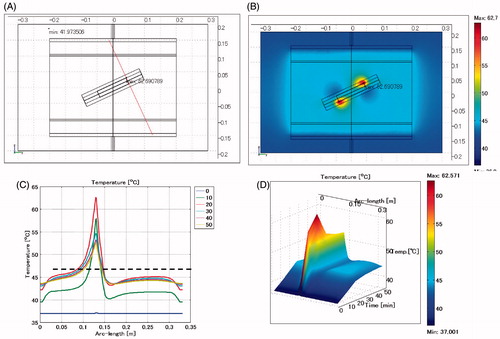
Table 3. Excessive temperature rise when using an oesophageal stent.
Table 4. Excessive temperature rise under various heating conditions.
Table 5. Adverse reactions when capacitive-type heating was applied in patients having a stent (Aino Hospital).
Table 6. Adverse reactions when capacitive-type heating was applied in patients having stents (Hospital of the University of Occupational and Environmental Health Japan).