Figures & data
Table I. General information and clinical characteristics. Patient age, body mass index, uterine volume, uterine fibroid volume and operative time were comparable between the HIFU and myomectomy groups, as expected from the randomized design (p > 0.05). Mean blood loss in the myomectomy group was 100 mL, but the HIFU group exhibited no blood loss. The post-operative stay in the HIFU group was significantly shorter than that in the MY group (1 versus 4 days, p < 0.001), and the time of out-of-bed activity in the HIFU group was significantly earlier than that in the MY group (1 versus 48 h, p < 0.001). The recovery time in the HIFU group was also significantly shorter than that in the MY group (7 versus 15 days, p < 0.001).
Table II. Adverse reactions and complications. Adverse events were observed in 49 (81.67%) patients in the HIFU group and 56 (93.33%) patients in the MY group. No significant differences in the number of adverse reactions were observed between the two groups (p = 0.095). One patient in the MY group required a component transfusion for operative blood loss, which reached 500 mL. Four (6.67%) patients experienced anaesthesia-related complications, and these patients recovered after proper treatment. Five (8.33%) patients in the MY group suffered fever, and these patients recovered after proper treatment. However, no post-operative complications were observed in the HIFU group. Data are expressed as frequency, n (%).
Figure 1. (A) Changes in the percentages of CD4+ T cells in the two groups at different time points. (B) Changes in the percentages of CD8+ T cells in the two groups at different time points. (C) Changes in the CD4+/CD8+ ratio in the two groups at different time points. The percentages of CD4+ and CD8+ T cell in the HIFU group were not significantly altered after treatment compared with pre-operative levels. In contrast, the percentages of CD4+ and CD8+ T cell in the MY group decreased significantly 24 h after conventional myomectomy (p < 0.001). The percentages of these cells increased slightly 72 h post-operation but remained significantly decreased compared to preoperative levels (p < 0.001). The CD4+/CD8+ T cell ratios were also decreased significantly 24 h and 72 h after conventional myomectomy (p < 0.001).
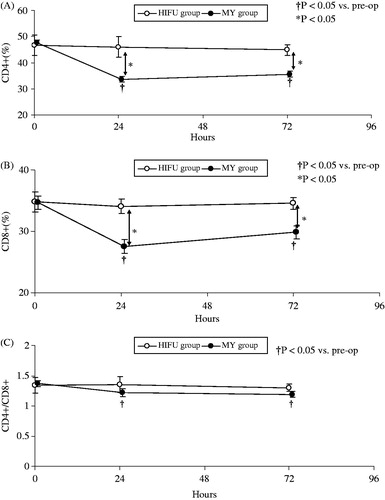
Figure 2. Changes in the percentages of NK cells in the two groups at different time points. The percentages of NK cells in the HIFU group were not significantly altered after treatment compared with preoperative levels. In contrast, the percentages in the MY group decreased significantly 24 h after conventional myomectomy (p < 0.001).
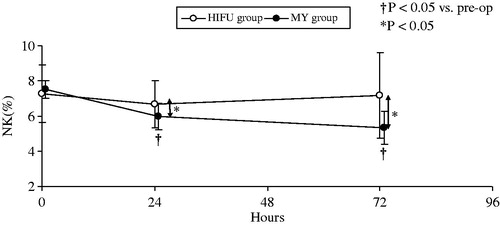
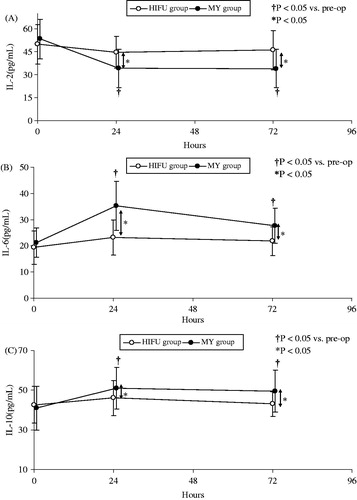
Figure 3. Serum IL-2, IL-10 and IL-6 levels at different time points in both groups. IL-6 and IL-10 levels increased after treatment in both groups. Peak IL-6 and IL-10 levels were significantly lower in the HIFU group than in the MY group (IL-6: 3.97 versus 14.05 pg/mL, p < 0.001; IL-10: 3.37 versus 10.07 pg/mL, p < 0.001). IL-6 and IL-10 levels remained significantly elevated for 72 h post-operation in the MY group but not in the HIFU group (p < 0.001). In contrast, by 24 h post-operation, IL-2 level decreased significantly in the MY group compared to the HIFU group (−19.34 versus −5.07 pg/mL, p < 0.001).