Figures & data
Figure 1. Geometry of the two-dimensional model used in the theoretical study (out of scale, dimensions in mm). The domain is divided into three zones: plastic portion of the electrode, metallic electrode and hepatic tissue.
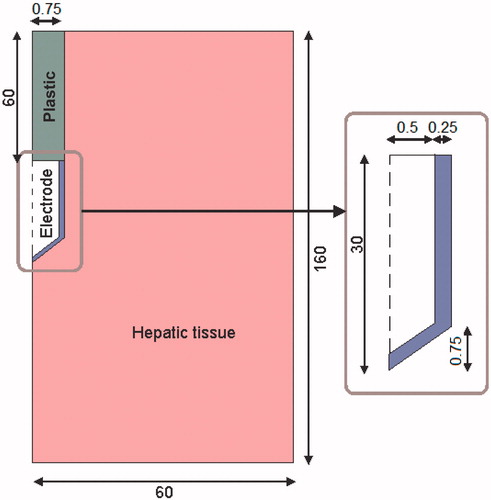
Table I. Characteristics of the materials used in the theoretical model [Citation11–Citation14].
Figure 2. Relative blood perfusion after delivery of 8 pulses of 100 μs at 1 Hz. The experimental data was obtained from [Citation8]. The model corresponds to equation (2).
![Figure 2. Relative blood perfusion after delivery of 8 pulses of 100 μs at 1 Hz. The experimental data was obtained from [Citation8]. The model corresponds to equation (2).](/cms/asset/30898ebd-24a3-4392-b095-c7a7c2b22e24/ihyt_a_777854_f0002_b.jpg)
Figure 3. Distribution of the relative blood perfusion (α) and the electric field (V/m) at the end of the application of the EP pulse.
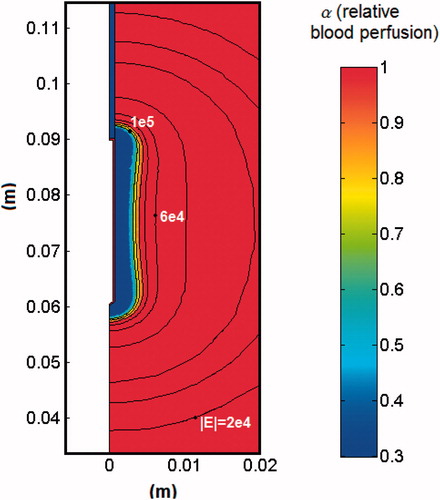
Figure 4. Voltage (A) and impedance (B) evolution in the computer simulations of EP + 12-min RF ablation case without plotting the EP period. (C) Impedance evolution in the computer simulations of RF ablation alone.
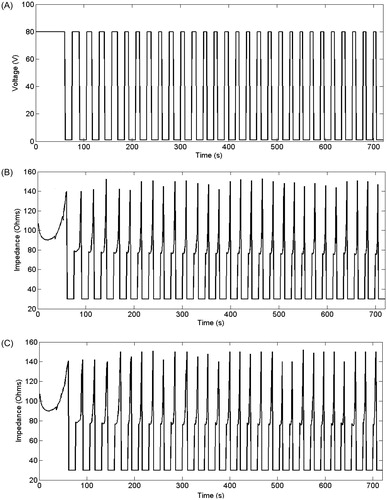
Figure 5. Temperature distributions after 12 min RF ablation and previous application of EP pulses. The black lines represent the thermal damage lesion which corresponds to Ω = 1 and Ω = 4.6. The values of the transverse lesion diameters (in cm) are shown for both contours of thermal damage.
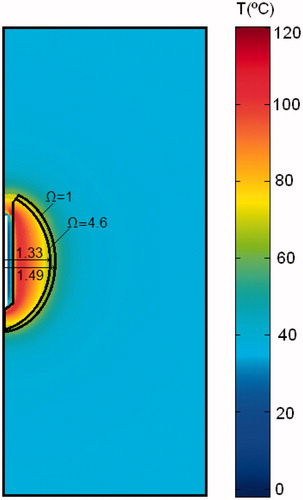
Figure 6. Temperature distributions after 12 min of RF ablation and previous application of EP pulses joint with the blood perfusion level (α) map.
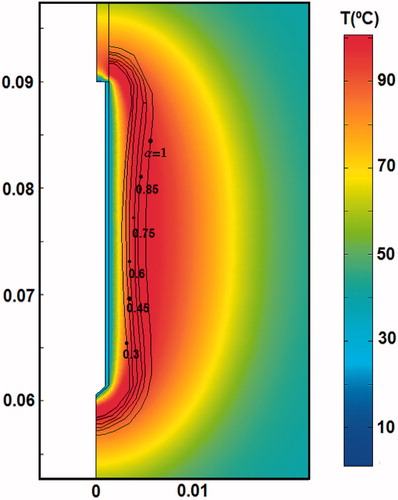
Table II. Transverse diameter of experimental and theoretical lesions created in liver after 720 s of RF ablation (RF) alone, and after 720 s of RF ablation combined with previous electroporation (EP + RF). Two thermal damage contours (Ω = 1 and Ω = 4.6) were used for the theoretical case. No significant differences between EP and RF + EP groups were observed either in the axial or in the transverse diameter.
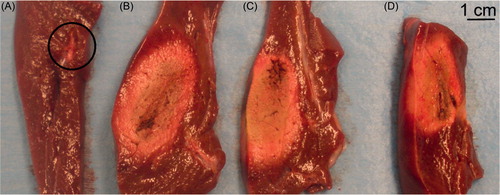
Figure 7. Lesions created in hepatic lobes after EP alone (A), RF ablation alone (B) and EP + RF ablation (C and D). In (A), the circle contains a two 2-mm wide hyperaemia along the electrode path, but no coagulation ‘white area’ was observed.