Figures & data
Table I. Patient characteristics.
Figure 1. FACS plot of Melan-A/Mart-1 specific CD8+ T-cells (Patient 1) using phycoerythrin conjugated ELAGIGTV-pentamer. The results show an increase from 1.09% before isolated limb perfusion to 6.08% after 4 weeks.
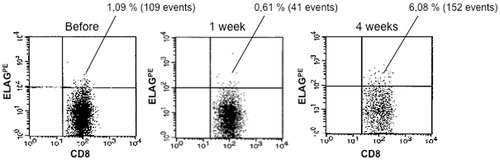
Figure 2. Levels (mean ± SD) of different lymphocyte subpopulations before and after (1 week, 4 weeks and 3 months) isolated limb perfusion. No significant changes were observed.
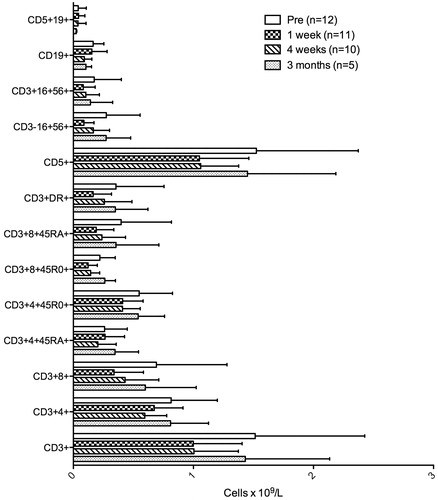
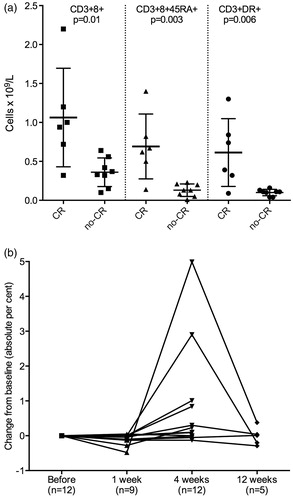
Figure 3. (a) Of the analyzed subpopulations in Figure 2, the levels of CD3+8+, CD3+8+45RA+ and CD3+DR+ cells were significant for clinical response. (b) Levels of Melan-A specific CD8+ T-cells during 12 weeks follow-up after isolated limb perfusion.