Figures & data
Figure 1. Stimulus pattern for fMRI block design. There was a 12 s dummy scan, and 30 s in the beginning of the run when participants were asked to only fix on the cross point and no task was required, followed by stimulus images. Participants judged whether the probe matched the target in the sample display with the whole process being limited to 30 s. Another fixation followed was continued 30 s. The programme mentioned above went on alternately for five blocks with a dummy scan of 30 s as the ending. The total time of the test was 5 min 42 s.
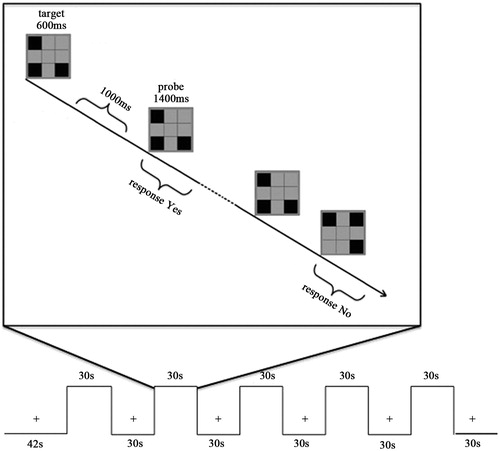
Table I. Intensity of DLPFC, IPS, IOS activation in ROI.
Figure 2. The statistical parametric map of an axial slice of the brain shows activation inversely proportional to visual short-term memory load in the bilateral DLPFC, IPS and IOS. The maps of upper row represented the control group and the lower row represented the hyperthermia group. Z, z axial in Talairach-Tournoux coordinates; T, t value; A, anterior; P, posterior; L, left; R, right.
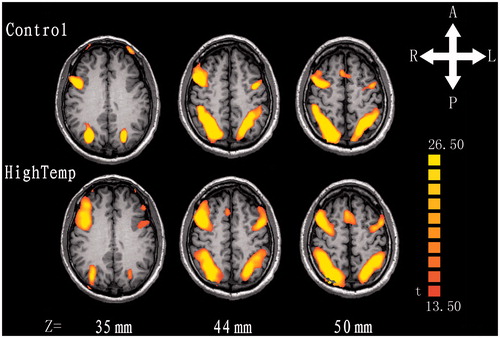
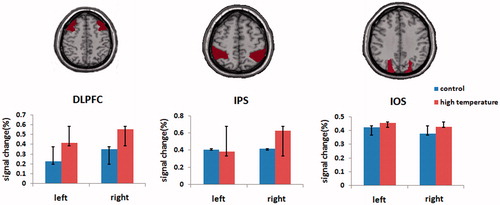
Figure 3. Activations were significantly enhanced in the bilateral dorsolateral prefrontal areas and right parietal lobe compared with that at regular temperature, and others were not significant between control and hyperthermia groups. Regions of interest for DLPFC, IPS and IOS are also shown, respectively.