Figures & data
Figure 1. Setup for in vivo imaging studies (image not to scale). The tumour, which is on the left flank and shaded dark grey, is pierced with the hot catheter. During heating, a peristaltic pump pushes heated water (55 °C) through the hot catheter. For drift correction, three oil references were placed around the tumour (shown above) and three oil references were placed under the rat’s body (not shown). Liposomes and anaesthesia were injected via tail vein catheter.
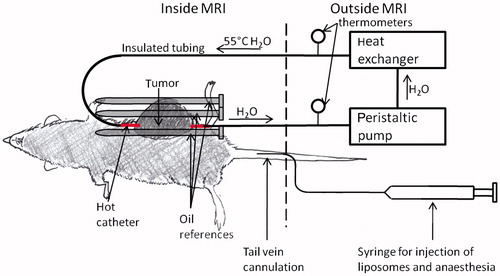
Table 1. Phase transition temperature (Tm) of Mn-LTSL in various media measured with DSC.
Figure 2. The effect of Mn2+ release on PRFS temperature. (A) A T1-weighted image of liposome samples, saline controls, and oil standards. The contents of the samples are indicated in the upper left of the samples. ‘o’ stands for silicone oil, ‘s’ stands for saline, and numbers stand for the overall Mn2+ concentration in Mn-LTSL samples in millimolar. During heating, 64 ± 1 °C air is blown through the bore, across the samples. (B) The temperature change during heating of a DI water sample and two Mn-LTSL samples, measured with MRI. Error bars are the standard error of the mean temperature change in each sample. (C) The MRI-measured temperature change in Mn-LTSL (ΔTCA) normalised to the temperature change in water (ΔTW) in the same image slice. Error bars for the Mn-LTSL data are equal to the standard error of the mean of three measurements. For free manganese, N = 2 and for Mn-LTSL, N = 4.
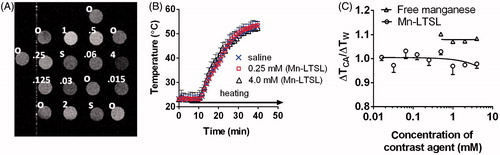
Figure 3. Release of Mn2+ from Mn-LTSL measured with ICP-AES. The time-release plots in saline of Mn-LTSL (0:9.8:5.2; DPPC:MSPC:DSPE-PEG2000; 50 mg lipid/mL; 63 mM overall Mn2+ concentration), was measured as a function of time. Error bars are the standard deviation of three measurements.
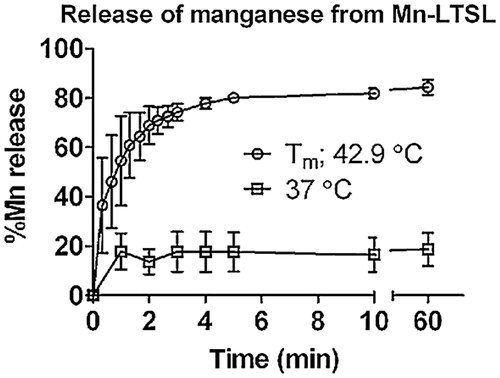
Figure 4. The temperature-dependent T1-weighted MRI signal of Mn-LTSL phantoms. (A) The normalised (to baseline) signal intensity in saline and Mn-LTSL (0.25 mM and 2.0 mM) during heating. Error bars are the standard error of the mean signal intensity in each vial, and are displayed in one direction for better visualisation. (B) The PRFS-measured temperature of the same samples shown in A. Error bars are the standard error of the mean. Calculation of absolute temperature for this experiment is described in the Set-up of phantom imaging experiments in the Methods section. (C) The normalised signal intensity of a saline, 0.25 mM and 2.0 mM Mn-LTSL sample, plotted as a function of sample temperature during heating. (D) The rate of signal enhancement (i.e. the first temporal derivative of the T1-weighted MRI signal) as a function of temperature. The positive (0.25 mM) curve demonstrates an important observation made by this study, namely that the rate of signal enhancement change during heating reaches a maximum as the Mn-LTSL sample (0.06–0.5 mM) reaches the Tm of the liposome.
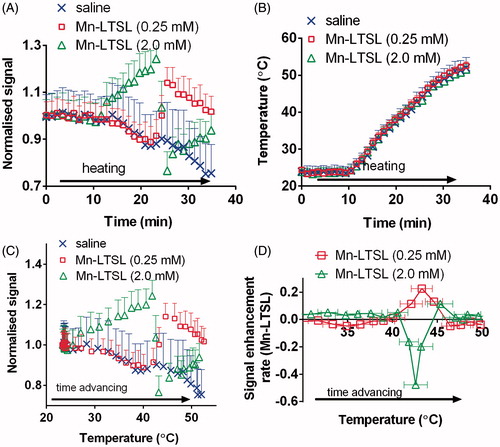
Table 2. Temperature at which the maximum MRI signal enhancement rate occurred (Mn-LTSL samples suspended in saline).
Figure 5. Conversion of temperature change (PRFS) to absolute temperature. (A) A T1-weighted image of the tumour prior to heating and Mn-LTSL injection. The catheter is labelled and the tumour outlined in white. (B) A temperature change map 5 min after initiation of heating. (C) A HTRR map of the tumour 5 min after initiation of heating. The annular ROIs used to analyse the data are superimposed. The innermost ring is ring 1 and the ring number increases as the rings move outwards. (D) A plot of the rate of change of HTRR (d(HTRR)/dt) in rings 2–4 as a function of time. (E) A plot of temperature change as a function of time, in the same rings as in C. (F) The rate of HTRR increase plotted as a function of temperature change. The data point above the dotted threshold line was used for calculating ΔTcal and calibration of the MRI temperature maps.
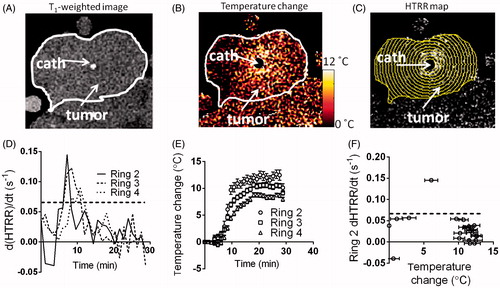
Table 3. Thermal parameters (Q/4k) of tumour and accuracy of calibration.
Figure 6. A comparison between the MRI-measured absolute temperature and modelled temperature distribution. (A) The MRI-measured absolute temperature for rat 1. No modelled temperature is shown for rat 1 because, as described in the main text, the value of Q.4k for this rat was much greater than the value of Q.4k for the tumours in Viglianti et al. [Citation30]. (B, C) The modelled and MRI-measured absolute T.r) for rats 2 and 3 respectively. Note that the ‘model’ data is not a fit to the MRI data, but is the temperature distribution in the tumour calculated from the procedure outlined in the methods section and Viglianti et al. [Citation30]. Error bars were calculated using Equation 6.
![Figure 6. A comparison between the MRI-measured absolute temperature and modelled temperature distribution. (A) The MRI-measured absolute temperature for rat 1. No modelled temperature is shown for rat 1 because, as described in the main text, the value of Q.4k for this rat was much greater than the value of Q.4k for the tumours in Viglianti et al. [Citation30]. (B, C) The modelled and MRI-measured absolute T.r) for rats 2 and 3 respectively. Note that the ‘model’ data is not a fit to the MRI data, but is the temperature distribution in the tumour calculated from the procedure outlined in the methods section and Viglianti et al. [Citation30]. Error bars were calculated using Equation 6.](/cms/asset/1e15b23f-ce31-4af6-8699-5b83e5be1946/ihyt_a_790091_f0006_b.jpg)
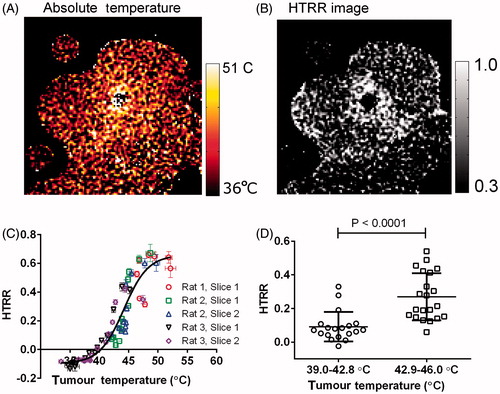
Figure 7. A spatial correlation between HTRR and absolute tumour temperature. (A) An image of absolute temperature in the rat tumour 15 min after the initiation of heating. (B) An image of HTRR 15 min after the initiation of heating. (C) A plot of the HTRR as a function of absolute temperature. Each data point corresponds to the absolute temperature (abscissa) and HTRR measurement (ordinate) in a single annular ROI (see ) 15 min after the initiation of heating. (D) In this graph only tumour regions that fell in the 39.4–45.9 °C temperature range 15 min after initiation of heating were considered, because this range surrounds the liposome bilayer Tm. The HTRR values for annular ROIs were split into a 39.4–42.8 °C group (below Tm) and a 42.9–45.9 °C group (above Tm), and each group was plotted in a separate column. The P-value was obtained with a one-tailed t-test without assuming equal variances between groups (Mann-Whitney test).