Figures & data
Figure 1. Schematic workflow for EM-HTP, using head and neck hyperthermia as an example. In US-HTP, the EM simulation and optimisation step is replaced by US simulation and optimisation.
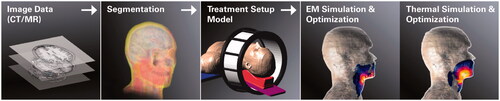
Figure 2. US pressure field prediction for a model of the InSightec ExAblate4000 system, illustrating the feasibility of 3D full-wave simulation for this system with 1024 independently driven transducers. The obtained pressure distribution is displayed with a logarithmic colour scale on three orthogonal planes through the target. The distorting impact of tissue parameter inhomogeneity on the focus shape is clearly visible. Modelling allows to plan the dynamic focus scanning, for contiguous heating of large tissue volumes.
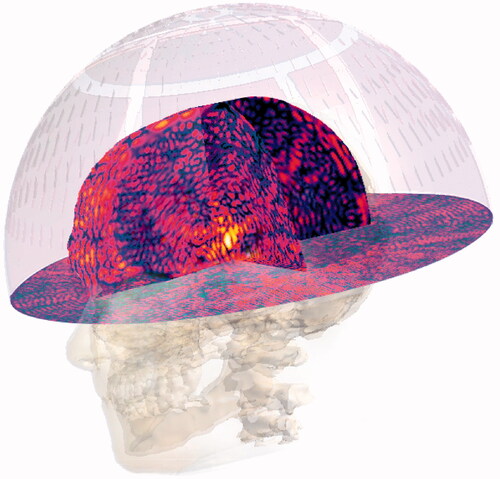
Figure 3. Cross-sections of the PD for 400 W (upper row) and temperature distributions (lower row) predicted by Sigma-HyperPlan for a large (left), average (middle) and slim (right) patient with a cervical tumour (red contour). Visible are also the slings on which the patient is positioned during deep HT (black or white circles on each side of the patient). The temperature distributions are obtained by increasing power until 44 °C in healthy tissue is reached.
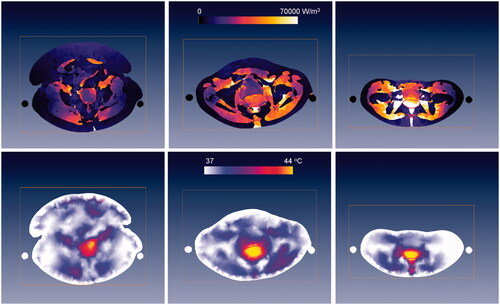
Figure 4. Combined use of segmentation, EM, and thermal solvers to generate initial temperature distributions in the pretreatment phase. During treatment, the MR temperature imaging (MRTI) provides feedback to empirically determine patient-specific parameters, e.g. perfusion. This information was used to steer the beam effectively to the target tumour on the right side of the leg and away from the muscle at the left of the bone [Citation67,Citation155].
![Figure 4. Combined use of segmentation, EM, and thermal solvers to generate initial temperature distributions in the pretreatment phase. During treatment, the MR temperature imaging (MRTI) provides feedback to empirically determine patient-specific parameters, e.g. perfusion. This information was used to steer the beam effectively to the target tumour on the right side of the leg and away from the muscle at the left of the bone [Citation67,Citation155].](/cms/asset/82deecfa-e386-4220-840a-f06ede0233bb/ihyt_a_790092_f0004_b.jpg)