Figures & data
Figure 1. (A) Model of temperature profiles during microwave ablations in liver tissue at various time points. The ablation zone temperature boundary grows more in the first 3 min, compared to the last 2 min. (B) Temperature elevation through the transverse cross section of ablation zone at various time points. Microwave ablation zones can reach temperatures as high as 150 °C. (C) SAR mapping of a microwave ablation zone along with corresponding temperature isotherms at 5 min.
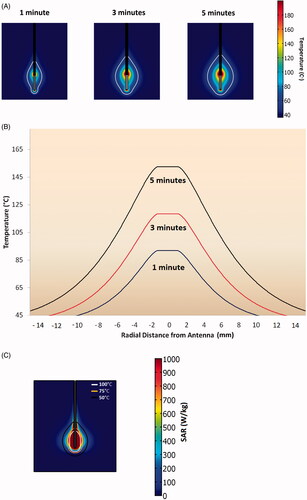
Figure 2. (A) Numerical modelling demonstrating nearly equivalent maximum ablation zone diameters between dipole antenna designs emitting power at 2.45 GHz (right) and 915 MHz (left). The colour bars represent the heating rate from 0--1000 W/kg. The white line iso-contour gives a visual approximation to the ablation heating zone. (B) The heating rate normalised by density, also known as the specific absorption rate (SAR). Microwave antenna performance at the two frequencies shows nearly equivalent SARs at radial distances 7 mm from the antenna.
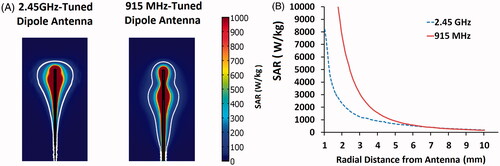
Figure 3. (A) Ex vivo tissue contraction is shown by placing pairs of high density wire markers 10–40 mm away from the antenna shaft. The original marker positions are shown in the top image and begin to move closer together as the microwave ablation begins and continues shrinking until the end of the procedure. (B) Graph showing distances between marker pairs decreasing during the ablation. Contraction is most rapid in the first 2–3 min.
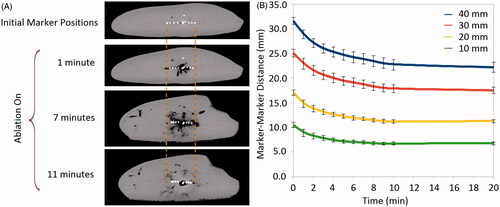
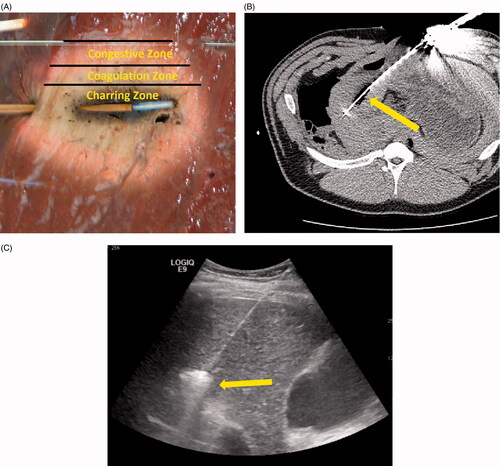
Figure 4. (A) Microwave ablation created in ex vivo liver tissue. The charred zone is the darkened area at the centre of the ablation zone which was highly desiccated from the intense heat and water vaporisation (>100 °C). The coagulation zone is the blanched region of the ablation zone, usually showing pyknotic nuclei on histology (70–100 °C). The congestive zone is the red peripheral area of the ablation zone that represents the boundary of the ablation zone and is sometimes called the transition zone (50–70 °C). (B) Intra-procedural imaging of a monopole antenna during an in vivo ablation procedure. The central hypo-dense zone identifies water vaporisation. (C) Gas bubbles resulting from water vaporisation are visible on ultrasound imaging and can be used to monitor treatment progress.