Figures & data
Table I. Patient and tumour characteristics.
Table II. Response and local toxicity according to perfusion time and temperature.
Figure 1. Flow-chart of the 163 included patients divided according to response (CR, complete response; PR, partial response; NC, no change; PD, progressive disease) and subsequent local progression and amputation rate.
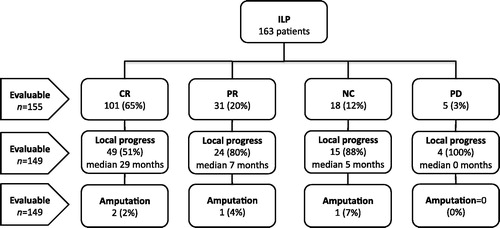
Table III. Univariate and multivariate logistic regression of clinical predictive factors for CR after isolated limb perfusion.
Figure 2. Local progression-free survival (LPFS) depending on (A) more or less than 10 in-transit metastases, (B) CR vs no-CR after ILP, (C) proximal or distal localisation of primary tumour. Estimates are calculated by the Kaplan-Meier method and the log-rank test.
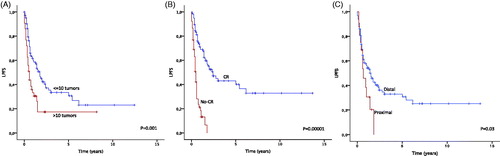
Table IV. Univariate and multivariate Cox-regression of clinical prognostic factors for local recurrence after isolated limb perfusion.
Figure 3. Cancer-specific survival depending on (A) sex, (B) lymph-node status, (C) presence of distant metastases, (D) bulky tumour, (E) more or less than 10 in-transit metastases, (F) CR vs. no-CR after ILP. Estimates are calculated by the Kaplan-Meier method and the log-rank test.
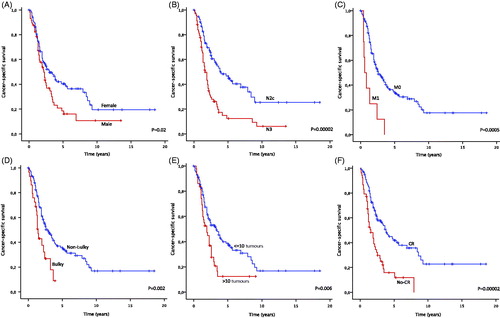
Table V. Univariate and multivariate Cox-regression of clinical prognostic factors for cancer-specific survival after isolated limb perfusion.
Table VI. Univariate and multivariate logistic regression of clinical predictive factors for toxicity (Wieberdink grade II vs. III) after isolated limb perfusion.