Figures & data
Figure 1. Antenna configuration and antenna-myocardium-blood numerical models (A) Antenna configuration (mm), (B) Perpendicular to the myocardium surface (90°), and (C) Parallel to the myocardium surface (0°).
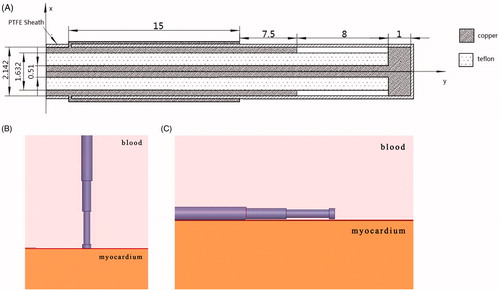
Table I. Dielectric parameters used in antenna model.
Table II. Dielectric and thermal parameters used in the numerical simulation.
Table III. Convective heat transfer coefficient in different applied locations.
Figure 2. Effect of thermal cooling at the endocardium (A) Antenna temperature, (B) 1417 W/(m2·°C), (C) No blood flow exists, (D) Antenna temperature, (E) 1417 W/(m2·°C), and (F) No blood flow exists.
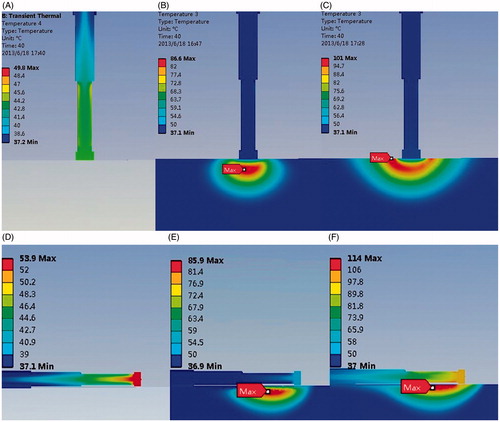
Figure 3. Thermal distributions with different convective heat transfer coefficient (30 W, 40 s).,(A) 1,417 W/(m2·°C), (B) 3,550 W/(m2·°C), and (C) 7,100 W/(m2·°C).
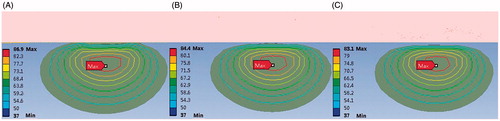
Figure 4. Lesion area with increasing time (P = 30 W) (A) Perpendicular to the endocardium and (B) Parallel to the endocardium.
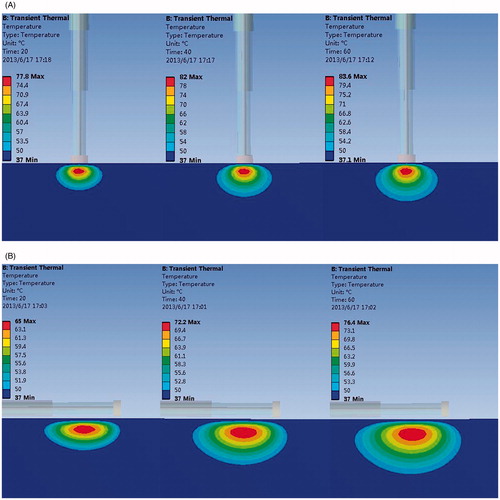
Figure 5. Top view of lesion area.
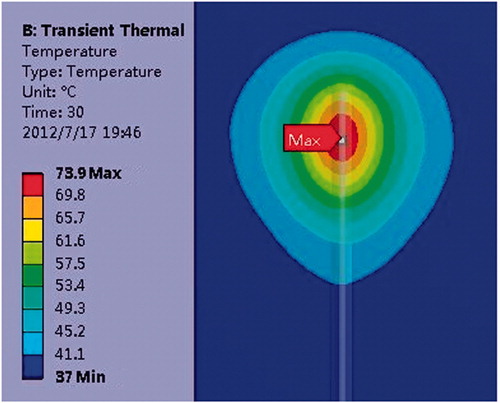
Figure 6. Width changes with increasing heating time (A) Perpendicular to the endocardium and (B) Parallel to the endocardium.
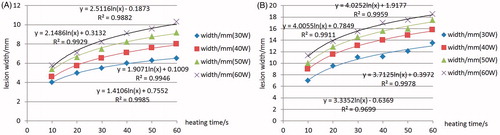
Figure 7. Depth changes with increasing heating time (A) Perpendicular to the endocardium and (B) Parallel to the endocardium.
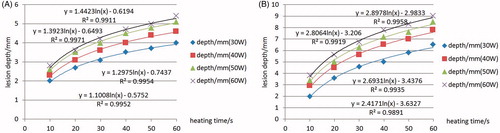
Table IV. Applied power and ablation time with different requiring lesion depth.