Figures & data
Figure 1. ELP response to clinical hyperthermia visualised with a dorsal skin-fold tumour window chamber. A thermally sensitive (green) and a thermally insensitive (red) ELP in a solid tumour before, during, and following hyperthermia treatment. (A) Prior to heating, the green and red levels were normalised to produce a uniform yellow throughout the vasculature. Between (B) 10 min and (C) 30 min of heating, the thermally sensitive ELPs began to adhere to the vasculature walls, indicated by the green punctate fluorescence. (D) Upon return to normothermia, the aggregates rapidly resolubilised and dissipated, demonstrating the reversibility of the ELP transition. The scale bar represents 100 µm in all images [Citation11].
![Figure 1. ELP response to clinical hyperthermia visualised with a dorsal skin-fold tumour window chamber. A thermally sensitive (green) and a thermally insensitive (red) ELP in a solid tumour before, during, and following hyperthermia treatment. (A) Prior to heating, the green and red levels were normalised to produce a uniform yellow throughout the vasculature. Between (B) 10 min and (C) 30 min of heating, the thermally sensitive ELPs began to adhere to the vasculature walls, indicated by the green punctate fluorescence. (D) Upon return to normothermia, the aggregates rapidly resolubilised and dissipated, demonstrating the reversibility of the ELP transition. The scale bar represents 100 µm in all images [Citation11].](/cms/asset/60ebc1f5-9274-4033-9bd7-597c5b0702fb/ihyt_a_819999_f0001_b.jpg)
Figure 2. Extravascular accumulation of a thermally sensitive ELP in a heated tumour as a function of time. Data were normalised by the initial vascular intensity and expressed as a percentage of vascular intensity at t = 0 min. The tumour was heated to 41.5 °C for 45 min and then cooled to 37 °C for 15 min for both the thermally sensitive (TS, square) and thermally insensitive (TI, circle) hyperthermia conditions. The tumour was not heated for the 37 °C TS ELP control (diamond). The data are expressed as mean ± SE. *p < 0.05, Fischer’s Protected Least Significant Difference post-hoc test for TS ELP with hyperthermia versus TI ELP with hyperthermia [Citation11].
![Figure 2. Extravascular accumulation of a thermally sensitive ELP in a heated tumour as a function of time. Data were normalised by the initial vascular intensity and expressed as a percentage of vascular intensity at t = 0 min. The tumour was heated to 41.5 °C for 45 min and then cooled to 37 °C for 15 min for both the thermally sensitive (TS, square) and thermally insensitive (TI, circle) hyperthermia conditions. The tumour was not heated for the 37 °C TS ELP control (diamond). The data are expressed as mean ± SE. *p < 0.05, Fischer’s Protected Least Significant Difference post-hoc test for TS ELP with hyperthermia versus TI ELP with hyperthermia [Citation11].](/cms/asset/b1d4bbd7-e6cd-4135-824d-1532208db26a/ihyt_a_819999_f0002_b.jpg)
Figure 3. Tumour regression in E0771 breast cancer model. E0771 cells were injected subcutaneously into the mammary fat pad of C57BL/6 mice. The mice were treated on day 0 (tumour volume = 150 mm3) with saline, free DOX, or SynB1–ELP–DOX with and without heat. Arrows indicate treatment on days 0, 2, 4, and 6. **A statistical difference was observed between SynB1–ELP–DOX hyperthermia group and saline (p < 0.0001), SynB1–ELP–DOX without hyperthermia (p < 0.0001), and free DOX without hyperthermia (p < 0.001) between day 7 and day 14 [Citation50].
![Figure 3. Tumour regression in E0771 breast cancer model. E0771 cells were injected subcutaneously into the mammary fat pad of C57BL/6 mice. The mice were treated on day 0 (tumour volume = 150 mm3) with saline, free DOX, or SynB1–ELP–DOX with and without heat. Arrows indicate treatment on days 0, 2, 4, and 6. **A statistical difference was observed between SynB1–ELP–DOX hyperthermia group and saline (p < 0.0001), SynB1–ELP–DOX without hyperthermia (p < 0.0001), and free DOX without hyperthermia (p < 0.001) between day 7 and day 14 [Citation50].](/cms/asset/bcc3cb96-cbc6-4fc6-9b15-4ded2c2a6e89/ihyt_a_819999_f0003_b.jpg)
Table I. Thermosensitive therapeutic micelles that respond to clinical hyperthermia.
Figure 4. Diblock micelles with thermosensitive coronas. (A) At temperatures below the transition temperature of the thermosensitive polymer (orange; pNIPAAm), the hydrophilic thermosensitive corona and the hydrophobic core (blue; poly(ε-caprolactone)) spontaneously assemble into micelles that can encapsulate drugs. (B) At temperatures above the LCST of pNIPAAm, the corona collapses into a hydrophobic coacervate, thereby destabilising the structure and releasing the drugs.
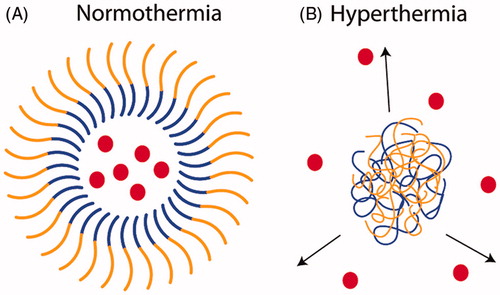
Figure 5. (A) Release profiles of DOX from DOX-loaded p(NIPAAm-co-DMAAm)-PLGA micelles at 37 °C (open markers; below the LCST) and 39.5 °C (closed markers; above the LCST) as a function of time [71]. (B) Intracellular uptake of p(NIPAAm-co-DMAAm)-PDLLA micelles labelled with a fluorophore as the temperature is cycled between 37 ° and 42 °C. Data represents mean ± SD. Reprinted with permission from J. Akimoto, M. Nakayama, K. Sakai, T. Okano, Mol Pharmaceut 2010;7:926–935 [Citation73]. Copyright 2010 American Chemical Society.
![Figure 5. (A) Release profiles of DOX from DOX-loaded p(NIPAAm-co-DMAAm)-PLGA micelles at 37 °C (open markers; below the LCST) and 39.5 °C (closed markers; above the LCST) as a function of time [71]. (B) Intracellular uptake of p(NIPAAm-co-DMAAm)-PDLLA micelles labelled with a fluorophore as the temperature is cycled between 37 ° and 42 °C. Data represents mean ± SD. Reprinted with permission from J. Akimoto, M. Nakayama, K. Sakai, T. Okano, Mol Pharmaceut 2010;7:926–935 [Citation73]. Copyright 2010 American Chemical Society.](/cms/asset/1be010c8-9c37-46f9-a323-0d5dd806f333/ihyt_a_819999_f0005_b.jpg)
Figure 6. Thermal properties of micelles of chimeric polypeptide-doxorubicin (CP-DOX) conjugates. (A) Relationship between the inverse transition temperature of a CP-DOX micelle (red squares) and an unconjugated CP of the same composition (blue circles). The inset displays a magnified view of the low concentration regime for each construct. (B) The CP-DOX micelle (red circles) transition temperature shows minimal dependence on the concentration, and thus remains within the hyperthermia window (solid black lines) over a wide concentration regime, whereas the ELP monomer used in previous hyperthermia studies (blue triangles) shows a strong concentration dependence [Citation13].
![Figure 6. Thermal properties of micelles of chimeric polypeptide-doxorubicin (CP-DOX) conjugates. (A) Relationship between the inverse transition temperature of a CP-DOX micelle (red squares) and an unconjugated CP of the same composition (blue circles). The inset displays a magnified view of the low concentration regime for each construct. (B) The CP-DOX micelle (red circles) transition temperature shows minimal dependence on the concentration, and thus remains within the hyperthermia window (solid black lines) over a wide concentration regime, whereas the ELP monomer used in previous hyperthermia studies (blue triangles) shows a strong concentration dependence [Citation13].](/cms/asset/c021f405-1487-4b91-be3d-73c78568906b/ihyt_a_819999_f0006_b.jpg)
Figure 7. Diblock micelles with thermosensitive cores. (A) A diblock ELP construct that consists of a conjugated drug (red circle), a hydrophobic block with a low Tt (blue), a hydrophilic block with a high Tt (orange), and a dysfunctional cell-penetrating peptide (CPP; green triangle). At physiological temperatures, the diblock is a soluble chain and the low arginine (Arg) density on the terminus of the ELPBC does not promote cellular uptake. (B) At ∼40 °C, desolvation of the hydrophobic block results in the assembly of spherical micelles that display a high density of Arg residues, thus creating a functional CPP motif on the surface of the nanoparticle. This results in the enhanced uptake of the nanoparticles by cells heated to the clinically relevant mild hyperthermia temperature of 42 °C.
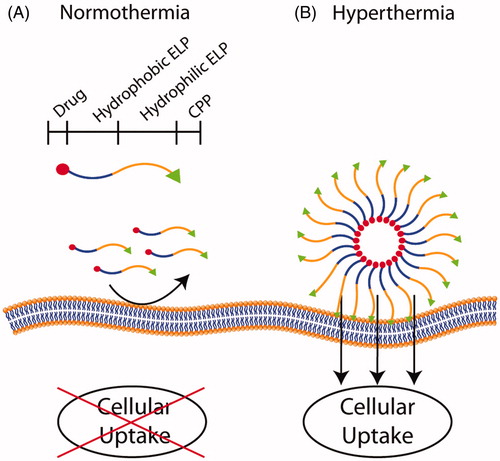
Figure 8. Modulating cellular uptake of thermosensitive ELPBC micelles. At 37 °C, (A) Arg5-ELPBC, (B) ELPBC, and (C) Arg5-ELP exist as unimers and do not exhibit significant cellular uptake. (D) At 42 °C, the temperature-triggered high-density presentation of Arg5 on the micellar surface results in enhanced cellular uptake (green). (E) The ELPBC micelle control lacking the Arg5 and (F) the Arg5-ELP unimer controls do not show enhanced uptake at 42 °C. Green, ELP; red, cellular membrane; blue, cell nuclei; and scale bars represent 25 µm [Citation12].
![Figure 8. Modulating cellular uptake of thermosensitive ELPBC micelles. At 37 °C, (A) Arg5-ELPBC, (B) ELPBC, and (C) Arg5-ELP exist as unimers and do not exhibit significant cellular uptake. (D) At 42 °C, the temperature-triggered high-density presentation of Arg5 on the micellar surface results in enhanced cellular uptake (green). (E) The ELPBC micelle control lacking the Arg5 and (F) the Arg5-ELP unimer controls do not show enhanced uptake at 42 °C. Green, ELP; red, cellular membrane; blue, cell nuclei; and scale bars represent 25 µm [Citation12].](/cms/asset/1ba220e7-c866-4ac3-ac2f-8d9896f96acd/ihyt_a_819999_f0008_b.jpg)