Figures & data
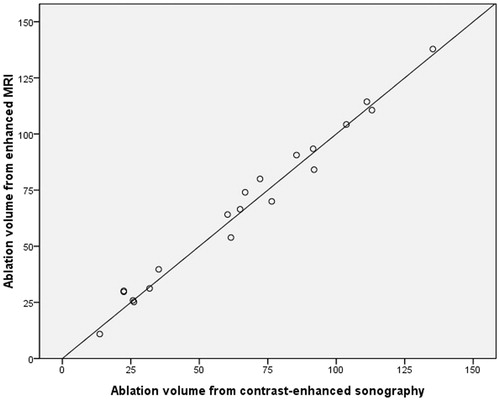
Figure 1. Ultrasound images in a 47-year-old woman with uterine myoma before and after microwave ablation therapy. (a) Sonogram obtained before microwave ablation shows a 7.0 × 5.7-cm uterine myoma (arrows) in uterine. (b) Colour Doppler Flow Image obtained before microwave ablation depicts the rich blood flow in the myoma. (c) Sonogram obtained 1 day after ablation shows that the myoma (arrows) has become heterogeneously hyperechoic; the size of the treated myoma is about 6.8 × 4.2 × 4.6 cm. (d) On a Colour Doppler Flow Image obtained 1 day after ablation, no blood signal is detected in the treated region (arrows). (e) Sonogram obtained 1 year after ablation shows that the myoma (arrows) has shrinked remarkably, and the size of the treated myoma is about 4.5 × 3.7 cm. (f) Power Doppler Flow Image obtained 1 year after microwave ablation depicts no blood signal in the myoma. (g) Contrast-enhanced sonogram obtained 1 day after ablation shows no contrast agent in the myoma, suggesting the complete necrosis of myomas (sagittal view). (h) Contrast-enhanced sonogram obtained 1 day after ablation shows no contrast agent in the myoma, suggesting the complete necrosis of myomas (transverse view).
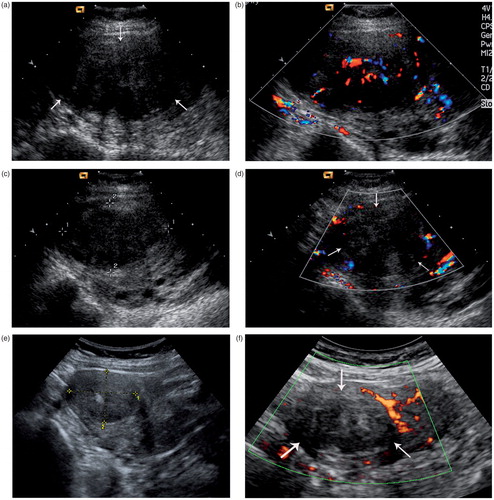
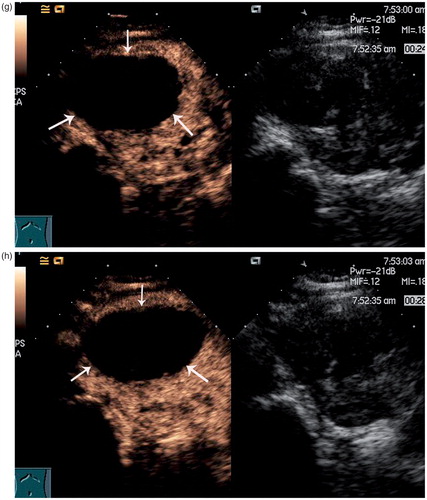
Table 1. Ablation volumes measured by two ultrasound radiologists by contrast-enhanced sonography (cm3).
Figure 2. MR images in a 47-year-old woman with uterine myoma after microwave ablation therapy. (a) On contrast-enhanced MR images obtained 1 day after ablation, no enhancement is seen in the treated myoma, suggesting the complete necrosis of myoma (sagittal T1WI MR). (b) On contrast-enhanced MR images obtained 1 day after ablation, no enhancement is seen in the treated myoma, suggesting the complete necrosis of myoma (axial T1WI MR).
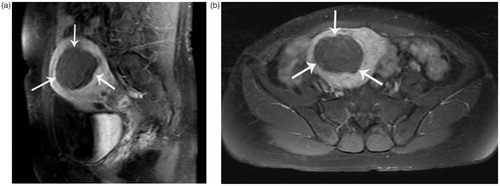
Table 2. Ablation volumes measured by two MRI radiologists on enhanced MRI scan (cm3).
Figure 3. Difference against average of ablation volumes from contrast-enhaced sonography and enhanced MRI (cm3), with 95% limits of agreement.
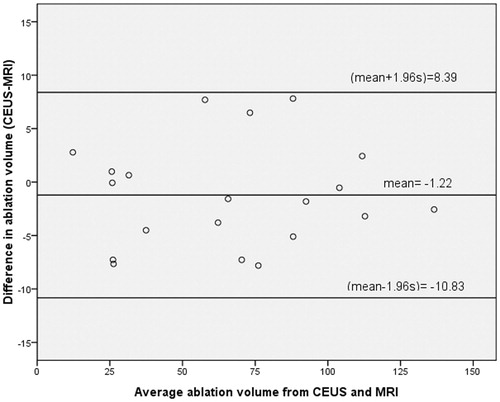
Table 3. Comparison between ablation volumes obtained from contrast-enhanced sonography and enhanced MRI (cm3).
Figure 4. Ablation volumes obtained from contrast-enhanced sonography and enhanced MRI scan (cm3), with regression line.