Figures & data
Figure 1. (A) T1-weighted gradient echo (GRE) sequence in the coronal plane to verify sheath position after CT-guided insertion of laser fibres before LITT procedure (FLASH, TE/TR 4.8/119, FA 90°, TA 2 s). Magnetic artefacts are caused by a magnetic marker inside the applicator system to enable a sufficient verification of the position. (B) MRI obtained after removal of the magnetic markers demonstrates the hypointense metastasis from a sarcoma in segment 4b with two laser fibres inserted.
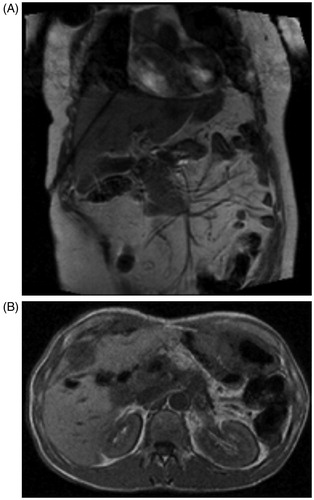
Figure 2. Display of progress of LITT treatment in a 69-year-old patient with liver metastasis from colorectal cancer in segment 8. (A) The T1-weighted axial GRE sequence (FLASH, TE/TR 4.8/119, FA 90°, TA 2 s) shows the metastasis (arrow) before LITT after removal of the magnetic marker between the laser fibres. (B) T1-weighted GRE sequence (same settings) shows the laser fibres 2 min after the start of the LITT procedure. An ellipsoidal-shaped area of hypointensity can be demarcated according to thermal damage. (C) MRI obtained with the same settings after 4 min of ablation. The area of coagulation is enlarging. (D) Image obtained after 9 min: necrosis manifests and an area with a total signal loss can be demarcated.
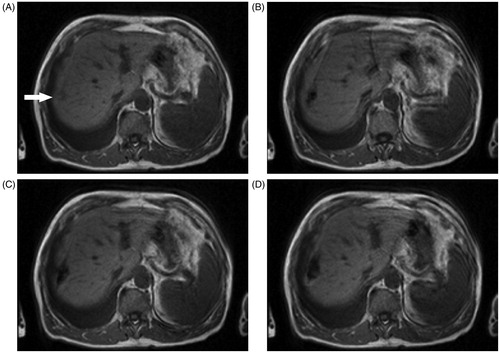
Figure 3. Mean energy amount (kJ) applied according to the treated metastasis diameter.
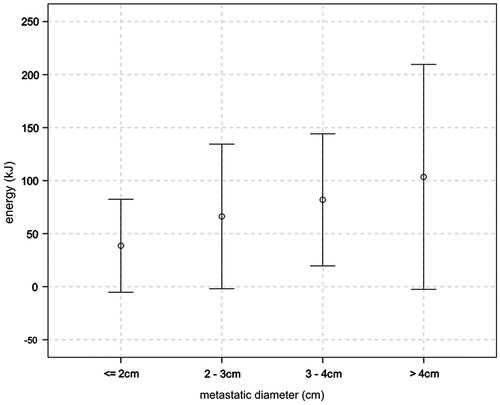
Figure 4. Mean values of the applied energy/volume (kJ/cm3) according to the segmental distribution of liver metastases treated with LITT.
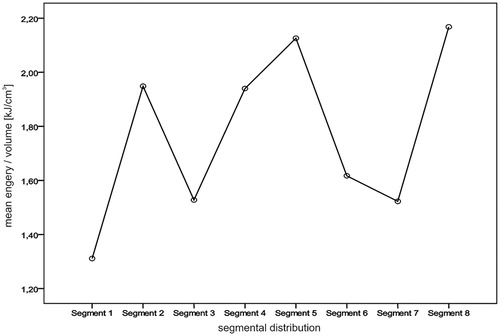
Table I. Amount of energy applied per volume of treated metastases during LITT.
Figure 5. Comparison between the last MRI T1-based treatment monitoring image, contrast-enhanced MRI obtained immediately after LITT and the contrast-enhanced MRI obtained 24 h after the treatment. (A–C) A 57-year-old patient with a hepatic metastasis in segment 4b. (D–F) Liver metastasis from colorectal cancer in segment 8 from a 69-year-old patient. (A) and (D) T1 weighted GRE sequences (FLASH, TE/TR 4.8/119, FA 90°, TA 2 s) demonstrate imaging of the progress of LITT treatment just before the end of the ablation procedure. Although image A is affected by motion of the surrounding organs, signal loss can clearly be demarcated due to the thermally induced cell damage. (B) and (E) T1 weighted contrast-enhanced GRE sequences after LITT (FLASH, TE/TR 4.8/119, FA 90°, TA 2 s) depict an area of enlarging hypointensity; a slight benign peripheral enhancement according to the reactive tissue reaction can also be demarcated [Citation10]. (C) and (F) Contrast-enhanced T1 weighted GRE (FLASH, TE/TR 101/1000 ms, FA 150°, TA 1 s/slice) show an extended hyperintense coagulation zone. In both cases a reposition of the applicator was performed to maximise the ablation zone. (C) depicts a larger coagulation area due to the two laser fibres used during the treatment, whereas (F) shows a rather ellipsoid shaped area. The puncture track is still visible as a thin dark hypointensity within the necrotic area.
![Figure 5. Comparison between the last MRI T1-based treatment monitoring image, contrast-enhanced MRI obtained immediately after LITT and the contrast-enhanced MRI obtained 24 h after the treatment. (A–C) A 57-year-old patient with a hepatic metastasis in segment 4b. (D–F) Liver metastasis from colorectal cancer in segment 8 from a 69-year-old patient. (A) and (D) T1 weighted GRE sequences (FLASH, TE/TR 4.8/119, FA 90°, TA 2 s) demonstrate imaging of the progress of LITT treatment just before the end of the ablation procedure. Although image A is affected by motion of the surrounding organs, signal loss can clearly be demarcated due to the thermally induced cell damage. (B) and (E) T1 weighted contrast-enhanced GRE sequences after LITT (FLASH, TE/TR 4.8/119, FA 90°, TA 2 s) depict an area of enlarging hypointensity; a slight benign peripheral enhancement according to the reactive tissue reaction can also be demarcated [Citation10]. (C) and (F) Contrast-enhanced T1 weighted GRE (FLASH, TE/TR 101/1000 ms, FA 150°, TA 1 s/slice) show an extended hyperintense coagulation zone. In both cases a reposition of the applicator was performed to maximise the ablation zone. (C) depicts a larger coagulation area due to the two laser fibres used during the treatment, whereas (F) shows a rather ellipsoid shaped area. The puncture track is still visible as a thin dark hypointensity within the necrotic area.](/cms/asset/2faf9a24-83a6-4298-877a-42a156e12eb8/ihyt_a_854931_f0005_b.jpg)
Table II. Mean energy applied and resulting volumes (mean) compared to the metastatic diameter prior to LITT treatment.
Table III. Mean measured volumes of ablated metastases during follow-up MRI.
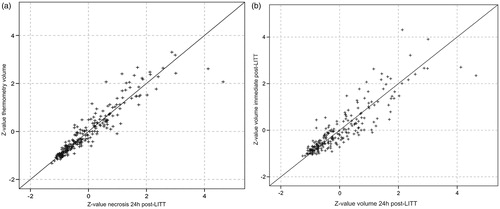
Figure 6. Correlation of necrosis volume measured 24 h after LITT with volume measured on contrast-enhanced MRI immediately after LITT (a), and MRI T1-based treatment monitoring during the ablation procedure (b). Z -standardisation demonstrates a narrowed scatter range of values on correlation of MRI T1-based treatment monitoring with MRI 24 h after LITT (b).