
Figures & data
Figure 1. The experimental set-up used for the phantom experiments. (A) The assembly used for the liquid experiments. (B) The assembly used for the chicken serum albumin experiments. (C) The positioning of the assembly on the CT table.
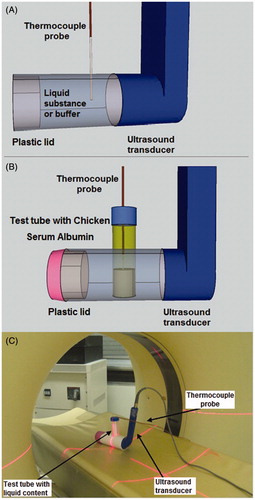
Figure 2. A pair of test tubes containing chicken serum albumin solutions, heated beyond the denaturation temperature (left) and a raw mixture (right).
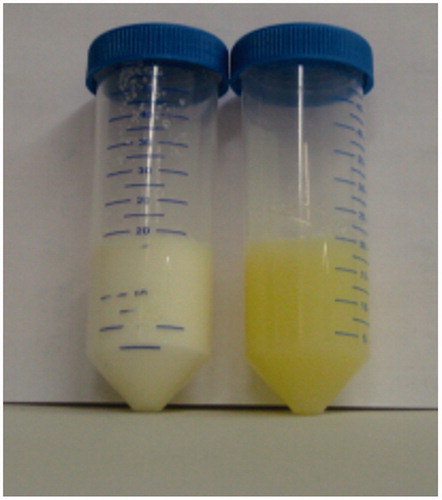
Figure 3. A schematic depiction of the apparatus used for the bovine ex vivo liver experiments. The HIFU beam was transmitted from the left side and its focus located at the central zone of the specimen.
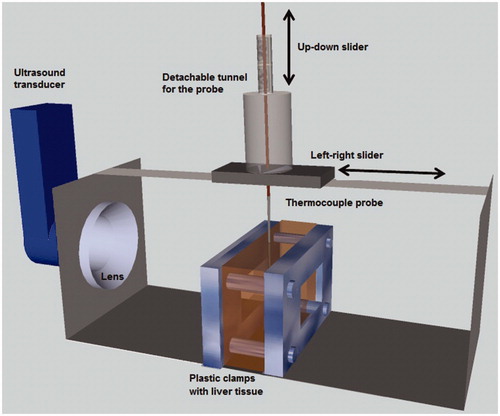
Figure 4. The CT Hounsfield unit values measured for water as a function of temperature during heating and cooling. The obtained results highly correlate with the exponential fit.
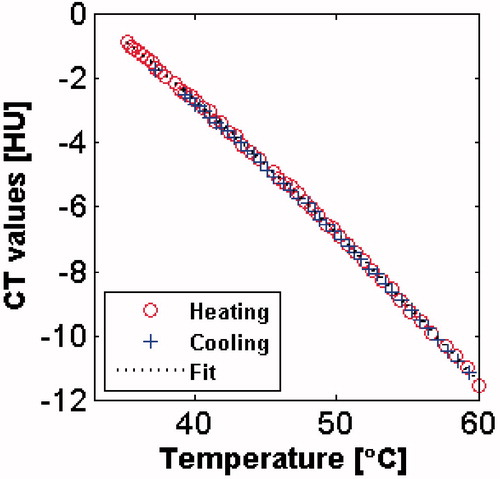
Figure 5. The CT Hounsfield unit values measured for oil during heating and cooling.
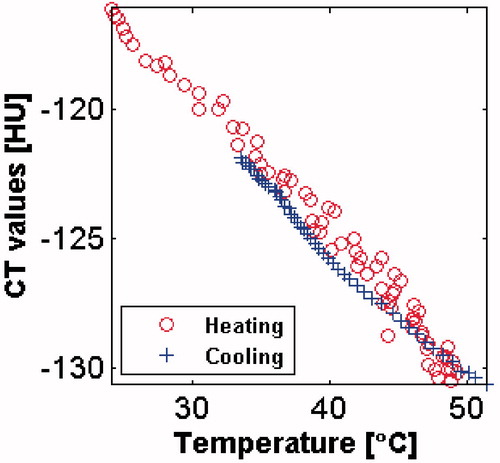
Figure 6. CT Hounsfield unit values measured for chicken serum albumin vs. temperature for four different heating conditions. The enclosed area and maximal disparity, at the matching temperature, are marked by the shaded area and the vertical line respectively. As can be noted there is no hysteresis when the maximal temperature is below 43 °C.
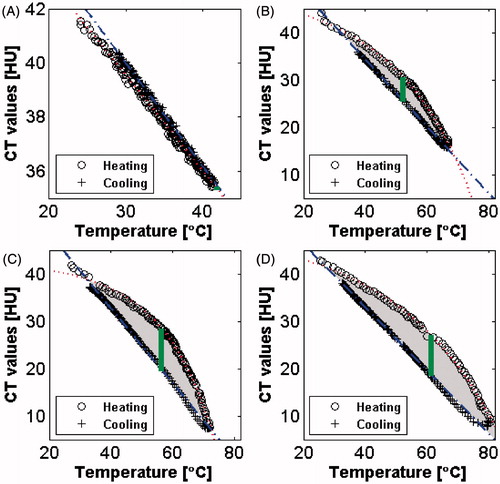
Table I. Summary of the three hysteresis quantification indices utilised for the chicken serum albumin.
Figure 7. Exemplary data sets for temperature vs. time (top) and HU vs. time (bottom), for both low and high thermal doses registered for ex vivo bovine liver experiments during heating and cooling stages. The error bars represent the standard deviation around the average value.
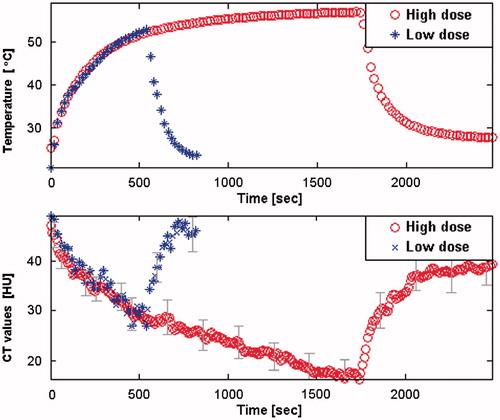
Figure 8. Ex vivo liver tissue HU values vs. temperature, for the high (A) and low (B) accumulated thermal dose. The enclosed area and maximal disparity, at the matching temperature, are marked by the shaded area and the vertical line respectively.
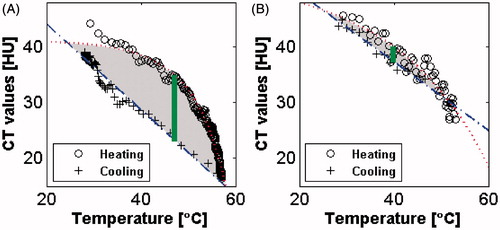
Table II. Summary of the three hysteresis quantification indices utilised for the ex vivo bovine liver experiments.