Figures & data
Figure 1. Extinction of nanoshells and nanorods. The extinction of the nanoshells and nanorods used in the study are shown. A broad plasmon resonance is observed for nanoshells, while a narrower resonance is observed for nanorods.
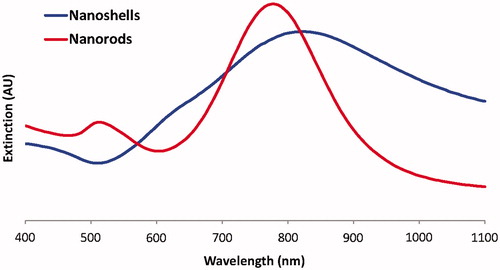
Figure 2. Experimental set-up. A schematic of the experimental set-up is shown. The FEM mesh is shown with T2-weighted and MRTI imaging overlaid. The arrow at the top depicts the laser direction relative to the phantom. The fluoroptic temperature probe can be seen in the T2-weighted image.
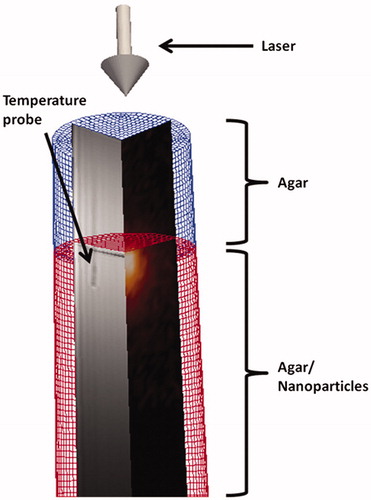
Table I. Optical and thermal parameters.
Figure 3. Temporal and spatial heating profiles. Temporal (left), axial (middle), and radial (profiles) of MRTI (blue ○) and heat transfer simulation (red line) for nanoshells (top) and nanorods (bottom). All plots of the same phantom share a common time point (black ⋄) at the position of maximum heating at t = 205 s to avoid the error caused by high temperature gradients that result from the laser being turned off. Distance measurements are zeroed to this common point, and the increased absorption efficiency of the nanorods is apparent as they reach a higher maximum temperature difference (13.8 °C MRTI/13.6 °C model) than the nanoshells (11.1 °C MRTI/10.5 °C model).
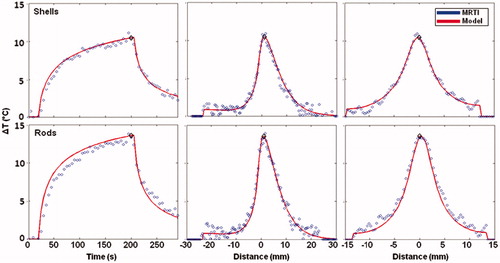
Figure 4. Dice coefficient of ΔT = 5 °C isotherms. Dice similarity coefficients were calculated for ΔT = 5 °C isotherms as a function of time (left) for nanoshells (top) and nanorods (bottom). Isotherms (right) are plotted for the model (green) and MRTI (blue) and the edges of the 95% confidence interval (thin blue) at 205 s for both nanoshells (top) and nanorods (bottom). The model falls within the 95% confidence interval for both particles except in the case of the rod plot, in which the model tends to predict temperatures consistent with the lower end of the confidence interval.
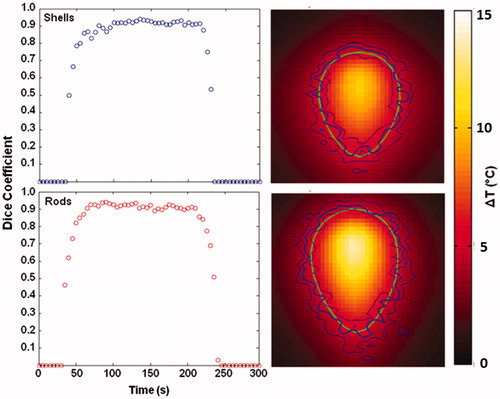
Figure 5. Weighted RMS differences. The wRMSE difference is shown as a function of time for nanoshells (blue solid) and nanorods (red solid) on an absolute scale and relative to the average uncertainty (σ) in MRTI measurements (dotted) at the same region of interest. The grey-shaded area represents times when the laser was turned on. In both cases the RMS difference stayed within 1.5σMRTI for the duration of the experiment. Large increases are seen at t = 30 s and t = 210 s because of the high temporal gradients associated with turning the laser on and off. Magnitude images are shown for each type of particle with the centre of heating, ROI, and position of fluoroptic probe (cyan) overlaid.
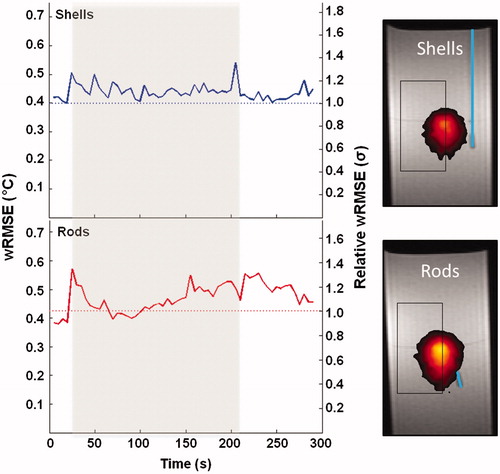
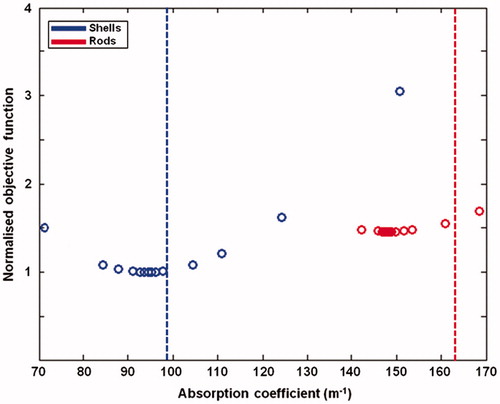
Figure 6. Minima of inverse problem solution. The objective function is plotted as a function of the value of the absorption coefficient used at each trial point in the inverse solution algorithm for nanorods (red) and nanoshells (blue). The objective function was taken from a region of interest centred on heating, did not receive any weighting to account for uncertainty in the MRTI, and was normalised to the minimum value observed. Over the range of physically realisable bounds, the change in the objective function appears to be convex, with the algorithm finding an absolute minimum in each case. Vertical lines are plotted to give the expected values of absorption, assuming literature values for the absorption-to-scattering ratio.