Figures & data
Figure 1. Heating of aminosilane-coated iron oxide nanoparticles by an alternating electromagnetic field. (A) Schematic of the induction coil system with cell culture chamber and fibre-optic probe for real-time temperature recording. (B) Flux 2D simulation of the magnetic field generated by the induction coil with 79.59A (16% PWR) and 139.2A (35% PWR) applied current (to produce 37 °C and 45 °C, respectively). The cell culture chamber is placed in the area of the coil that generates the most uniform magnetic field as demarcated by the black contour rectangle. (C) Example of sample temperature reading as a function of time. Each point is the average of three samples and the error bars indicate one standard deviation. For comparison, temperature data for water bath heating (45.5 °C bath) is also included.
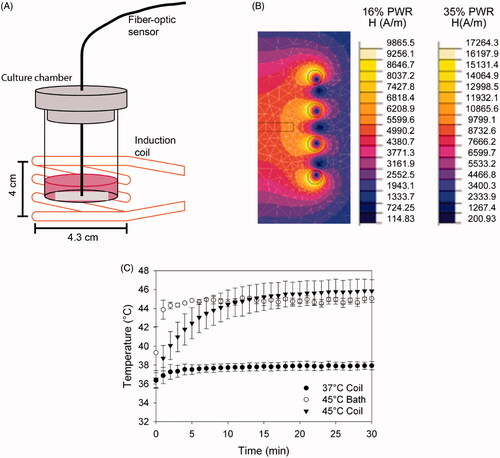
Figure 2. Viability assessment of primary cortical neurons exposed to heat generated by iron oxide nanoparticles in an alternating electromagnetic field or a water bath. Images of live neurons by calcein-AM (green) and dead nuclei by propidium iodide (red) 24 h after exposure to: control without nanoparticles (37 °C inc. w/o P) (A), and with nanoparticles (37 °C inc. w/P) stored in the incubator (B), heating to 45 °C by water bath immersion (45 °C bath) (C), and by magnetic stimulation (45 °C coil) for 2 h (D), both in the presence of nanoparticles. Quantification of the percentage area covered, of each image relative to the control for live neurons (E) and dead nuclei (F). For comparison, these graphs also show results for cells with nanoparticles heated to 37 °C for 2 h in a water bath (37 °C bath) and a magnetic field (37 °C coil). All samples with nanoparticles were significantly reduced in the percentage area covered as compared to the control, whereas only the 45 °C coil sample displayed a statistically significant increase in the number of dead nuclei (*p < 0.05 relative to control without particles). Error bars represent one standard deviation, n = 9 for all samples. All images are captured with a 20× objective lens. Scale bar represents 50 μm. For interpretation of the references to colour in this figure legend, the reader is referred to the web version of this article at www.informahealthcare.com.
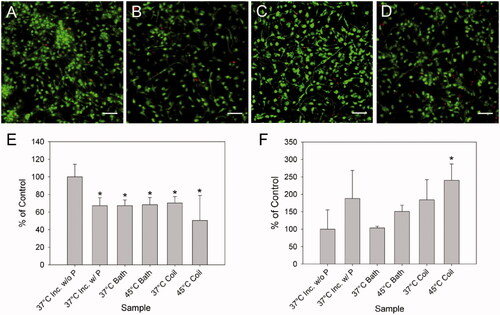
Figure 3. Metabolic activity of cortical neurons exposed to hyperthermic conditions as determined by the alamarBlue® assay. Samples were analysed 24 h after exposure to 0.5 h, 1 h and 2 h heating at 37 ° or 45 °C in an alternating magnetic field. All samples were measured for absorbance at 570 nm using a multi-well plate reader. All values are expressed as a percentage of the control; error bars represent one standard deviation. All samples are statistically similar, indicating no influence of heating duration or temperature on the neuronal metabolic processes (n = 6).
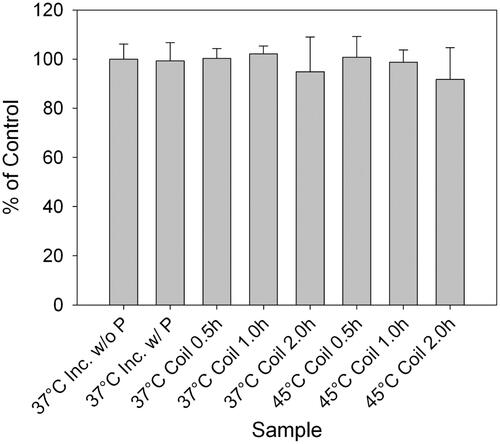
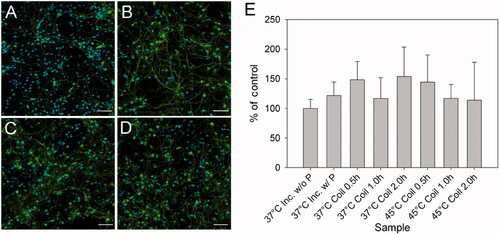
Figure 4. Fluorescent images of cortical neurons stained for neurofilament (green, RT97) and nuclei (blue, DAPI) 24 h after exposure to the corresponding heating dosage. (A) Control without (37 °C inc. w/o P) and (B) with (37 °C inc. w/P) nanoparticles and cultures heated by magnetic stimulation for 2 h at (C) 37 °C (37 °C coil 2.0 h), and (D) 45 °C (45 °C coil 2.0 h). Each image is a composite of four images stitched together. All images were captured using a 40× objective lens. Scale bar represents 50 μm. (E) Neurofilament percentage area for cultures shown in A–B and other cultures heated to 37 °C or 45 °C for 0.5 h and 1 h. All images are statistically similar (n = 6, error bar represents one standard deviation), indicating no reduction in neurite processes as a function of time and temperature of heating process. For interpretation of the references to colour in this figure legend, the reader is referred to the web version of this article at www.informahealthcare.com.