
Figures & data
Figure 1. A demonstration of the gelling of the chitosan preparation. (a) In solution, (b) gelling after inversion, (c) photograph showing a 5-mm thick gel (black arrow) located between R1 and R2 and 5 mm from the microwave ablation needle fissure (red arrows). For interpretation of the references to colour in this figure legend, please refer to the web version of this article at informahealthcare.com.
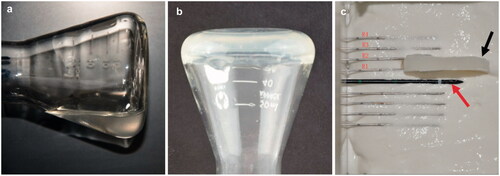
Figure 2. (a) Real-time temperature difference between the R1 and R2 thermometry needles. (b). Temperatures of the R2, R3, and R4 needles when the temperature at R1 was 60 °C. The mean temperatures at R2, R3, and R4 were 29.7° ± 0.4 °C, 18.6° ± 0.2 °C, and 16.0° ± 0.3 °C, respectively.
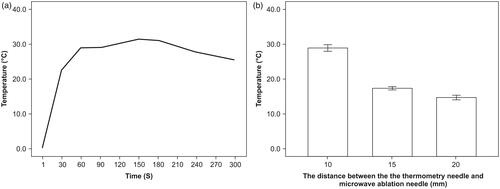
Figure 3. (a) Ultrasonographic view showing placement of the ablation needle (white arrow), with the in situ gel (red arrow) located between the liver and stomach wall (blue arrows). (b) Enhanced CT scan after ablation showing in situ gel (red arrow) between the lesion (white arrow) and the stomach wall (blue arrows). (c) Contrast-enhanced ultrasound CEUS, showing the gel (red arrow) located between the lesion (blue arrow) and the stomach wall (white arrow). (d) Photograph showing the microwave ablation area (white arrow) and the adjacent stomach wall (black arrow). (e) Histopathology, showing no stomach wall damage (H&E staining). For interpretation of the references to colour in this figure legend, please refer to the web version of this article at informahealthcare.com.
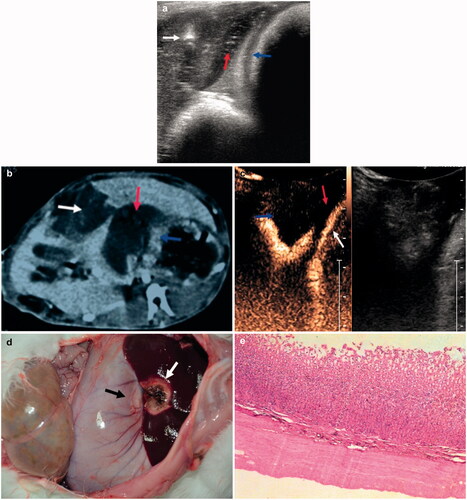
Figure 4. (a) Photograph showing the ablated areas (white arrow) and the injured stomach wall (black arrow). (b) Ultrasonographic image showing the artificial ascites were 0.6 cm wide (white arrow) between the liver (red arrows) and the diaphragm (black arrow). (c) Ultrasonographic image showing successful injection of artificial ascites, ultrasound-guided placement of ablation needle (white arrow) between the liver and the stomach wall (red arrow), and the formation of ascites 0.2 mm in width (blue arrows). (d) Histopathological examination showing thermal damage to the outer muscular layer of the stomach wall (black arrow). For interpretation of the references to colour in this figure legend, please refer to the web version of this article at informahealthcare.com.
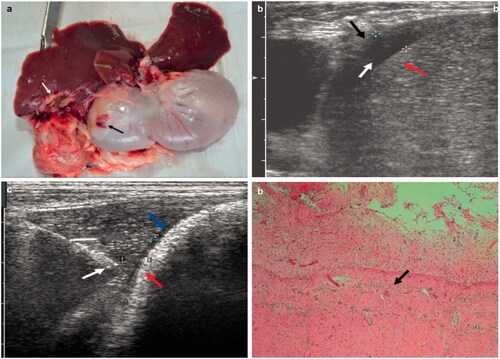
Figure 5. (a) Ultrasonographic image showing that the distance between the ablation needle (white arrow) and the stomach wall (blue arrow) was approximately 5 mm. (b) Photograph showing the ablation areas (white arrow) and the adjacent stomach wall (black arrow). (c) Histopathological examination showing injury to the mucous layer of the stomach wall (black arrow). For interpretation of the references to colour in this figure legend, please refer to the web version of this article at informahealthcare.com.
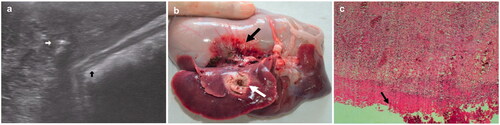
Table I. Levels of pathological thermal damage to the stomach wall in the three groups of New Zealand white rabbits.
Table II. Comparisons of the maximum short-axis diameter of the ablation lesions and the thermal injury level of the stomach wall between the two experimental groups.
Table III. Comparison of the short-axis diameter of the ablation area and the injury level of the stomach wall between rabbits injected with chitosan gel and control rabbits.