
Figures & data
Figure 1. Experimental set-up.
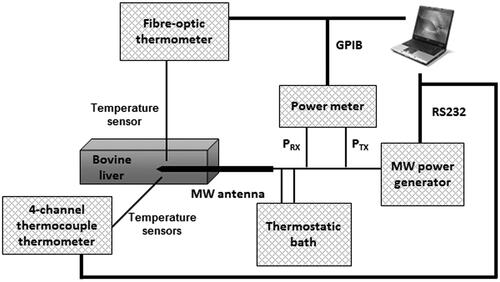
Figure 2. View of the plastic box with the tissue sample, temperature probes, and MW antenna.
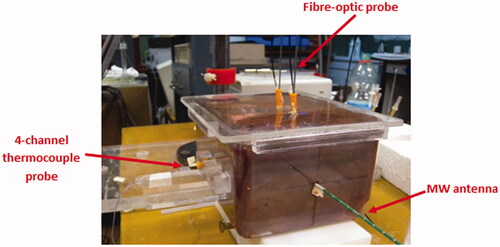
Figure 3. Detail of temperature probes orthogonally positioned with respect to the MW antenna (distances are not in scale).
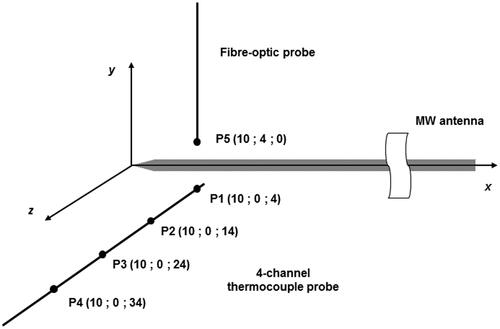
Figure 4. Sagittal cut of a liver sample along the MW antenna insertion plane after a MTA treatment and assessed isothermal lines.
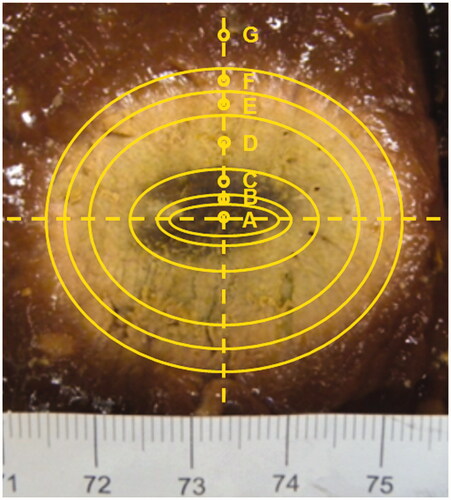
Figure 5. Temperature patterns (mean values and standard uncertainties (95% CI)) measured by the fibre-optic probe and by a thermocouple probe in the tissue area of maximum power deposition [Citation19] (points P1 and P5, as in ) during MTA trials (40 W, 10 min) and for 10 min after switching off the MW power.
![Figure 5. Temperature patterns (mean values and standard uncertainties (95% CI)) measured by the fibre-optic probe and by a thermocouple probe in the tissue area of maximum power deposition [Citation19] (points P1 and P5, as in Figure 3) during MTA trials (40 W, 10 min) and for 10 min after switching off the MW power.](/cms/asset/a6e2bca0-cc79-4990-9689-9ef412d915da/ihyt_a_879744_f0005_b.jpg)
Table I. Temperature values measured at the end of the MTA procedure (just before switching off the MW power) as a function of the distance from the MW antenna axis (measurement points P1–P4 as in ).
Figure 6. Temperatures (mean values and standard uncertainties (95% CI)) measured at the end of the MTA procedure just before switching off the MW power () in the tissue area of maximum power deposition [Citation19], and best fit exponential regression as a function of the distance from the MW antenna axis.
![Figure 6. Temperatures (mean values and standard uncertainties (95% CI)) measured at the end of the MTA procedure just before switching off the MW power (Table I) in the tissue area of maximum power deposition [Citation19], and best fit exponential regression as a function of the distance from the MW antenna axis.](/cms/asset/378e4e29-af73-486d-a322-0f67c3fdc771/ihyt_a_879744_f0006_b.jpg)
Figure 7. Sagittal cut of a liver sample along the MW antenna insertion plane after a MTA treatment (40 W, 10 min).
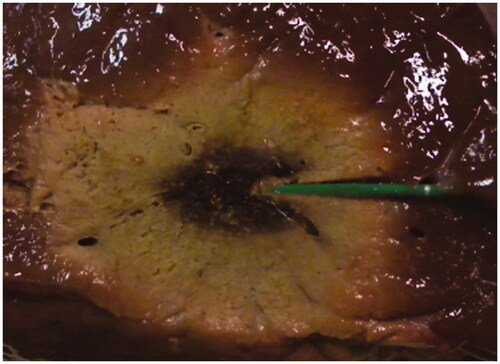
Table II. Dielectric parameters measured at 2.45 GHz (mean values and standard deviations) and assessed temperature ranges as a function of the distance from the MW antenna axis.
Figure 8. Comparison on the experimental results (mean values and standard deviations) of the relative permittivity (A), and conductivity (B) as a function of the temperature, measured after the end of the MTA procedure at different distances from the MW antenna axis (measured post, 40 W, 10 min, ) and during a MTA procedure at a fixed location (measured real-time, 30 W, 10 min [Citation24]).
![Figure 8. Comparison on the experimental results (mean values and standard deviations) of the relative permittivity (A), and conductivity (B) as a function of the temperature, measured after the end of the MTA procedure at different distances from the MW antenna axis (measured post, 40 W, 10 min, Table II) and during a MTA procedure at a fixed location (measured real-time, 30 W, 10 min [Citation24]).](/cms/asset/98d78d00-eaa0-407f-88c5-d7d29404aba3/ihyt_a_879744_f0008_b.jpg)
Table III. Regression coefficients and R2 for weighted cubic polynomial functions.
Table IV. Regression coefficients and R2 for weighted sigmoid functions.
Figure 9. Sigmoid and cubic best-fit models of temperature-dependent dielectric parameters with respect to measured data (mean values and standard deviations): (A) relative permittivity, (B) conductivity (S/m).
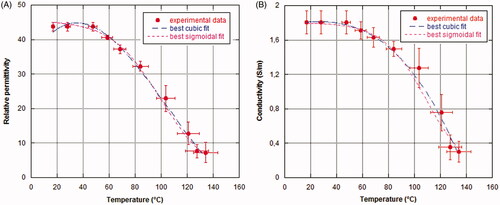
Table V. Mean percentage difference in fitting models of temperature-dependent dielectric parameters compared to percentage standard deviations of experimental data.
Figure 10. Comparison between the sigmoid functions evaluated in this work and the sigmoid functions proposed by Ji and Brace [Citation23]: (A) relative permittivity, (B) conductivity (S/m).
![Figure 10. Comparison between the sigmoid functions evaluated in this work and the sigmoid functions proposed by Ji and Brace [Citation23]: (A) relative permittivity, (B) conductivity (S/m).](/cms/asset/7c6329c6-0557-4ca1-9b31-18c7a3cd8485/ihyt_a_879744_f0010_b.jpg)