Figures & data
Figure 1. In vitro FUS set-up (A) and dual-compartment set-up (B) consisting of a sample holder placed into a glycerol-filled cuvette.
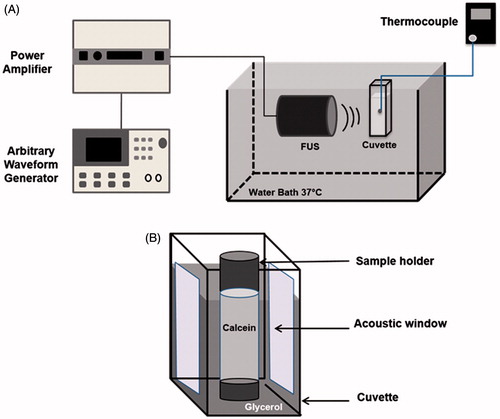
Figure 2. Liposomes size (nm) and polydispersity index (brackets) as a function of extrusion cycle number in presence of various CHOL mol% (n = 3).
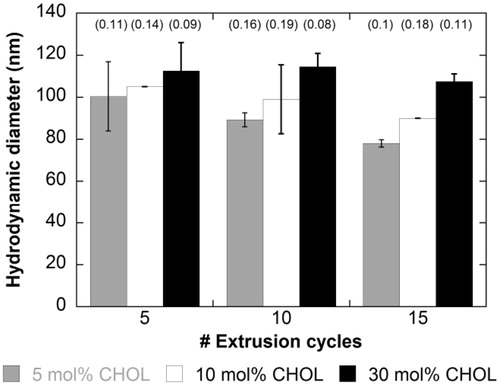
Figure 3. DSC thermograms obtained from liposomes made of DPPC/CHOL/DSPE-PEG2000 upon heating at 5 °C/min according to CHOL mol%.
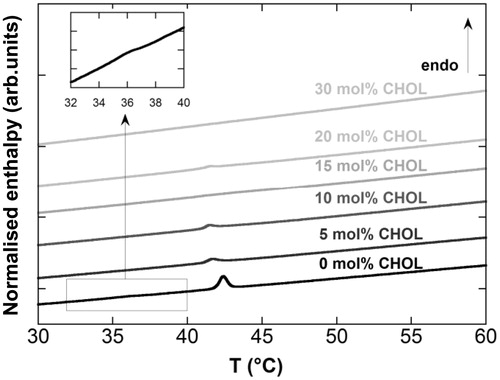
Figure 4. Tonset and corresponding normalised enthalpy obtained from liposomes upon heating at 5 °C/min according to CHOL mol%.
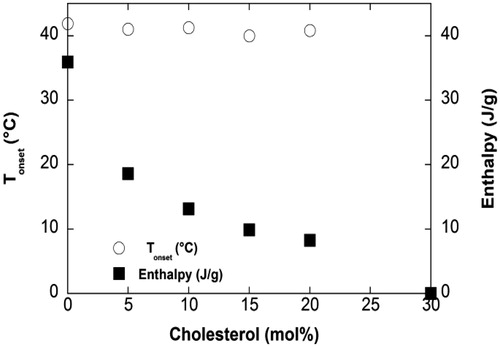
Figure 5. Release profile of encapsulated calcein from the different liposomal systems according to CHOL mol% and heating temperature for 5 min (n = 3) using a water bath.
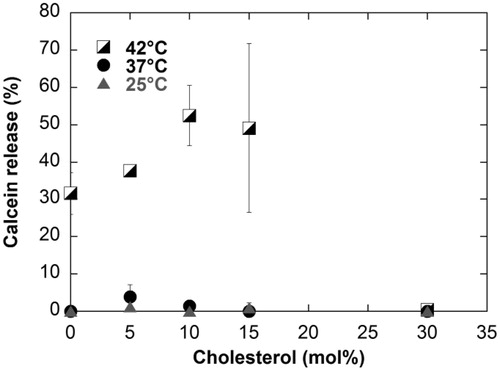
Figure 6. (A) Comparison of the temperature increases induced by FUS (1.75 MPa, 400 cycles, 1 kHz PRF) using glycerol-filled or water-filled cuvettes. Panels B and C show time–temperature curves as a function of the acoustic parameters using the glycerol-filled cuvette. Results are displayed as a function of the peak-negative pressure (400 cycles, 1 kHz PRF) in panel (B) and the number of cycles (1.75 MPa, 1 kHz PRF) in panel (C).
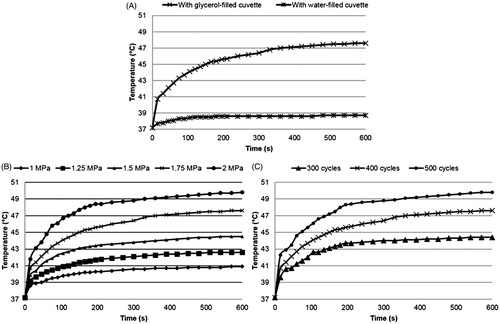
Figure 7. Temperature dependence of liposome calcein release after 10 min water bath (WB) heating (A). Results after FUS exposure are displayed as a function of acoustic pressure in panel B for 400 cycles, repetition of 1 kHz and 10 min insonation (n = 3).
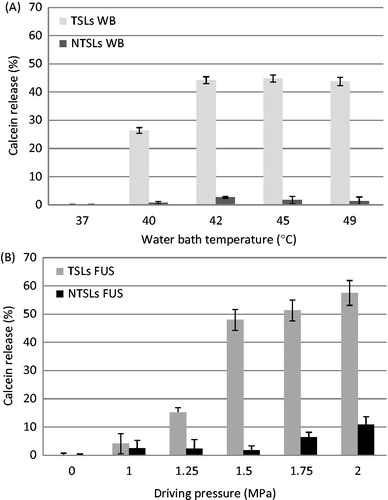
Figure 8. Calcein release from liposomes as a function of the exposure duration for water bath (WB) and FUS heating (n = 3).
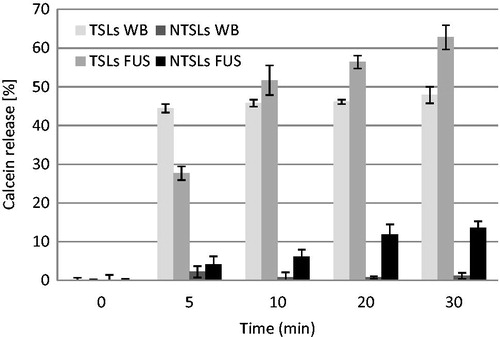
Figure 9. Cryo-TEM images of TSLs after 10 min heating in a water bath at 37 °C (A) and at 42 °C (B). Images of TSLs after FUS exposure (400 cycles, 1 kHz PRF, exposure time 10 min) at 1 MPa and at 2 MPa are displayed in panels C and D, respectively. Scale bar, 100 nm.
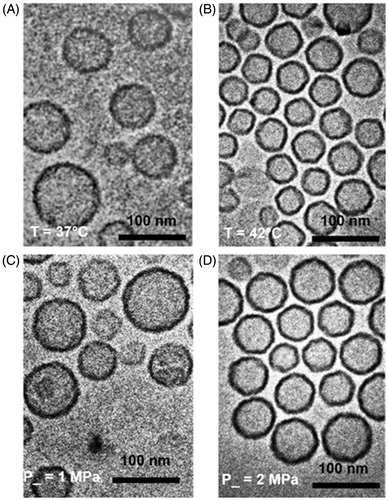
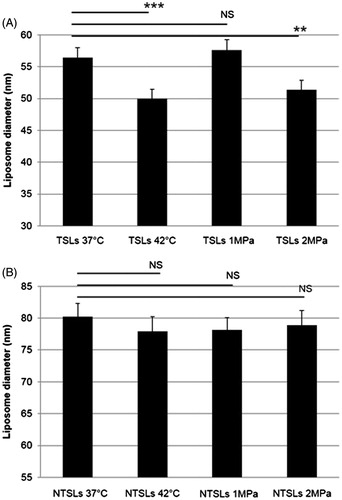
Figure 10. Mean diameters of TSLs (A) and NTSLs (B) exposed to different water bath and FUS heating for 10 min (n = 100 liposomes). Statistical analysis was performed using the nonparametric Mann-Whitney test. Significance was defined as p < 0.05 (*p < 0.05, **p < 0.01, ***p < 0.001, NS, non-significant).