Figures & data
Figure 1. Heat stress protocol.
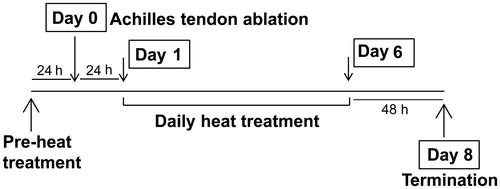
Figure 2. Effects of heat stress and tenotomy on wet weight of soleus and plantaris muscles. (A) Absolute muscle wet weight. (B) Relative muscle wet weight normalised with body weight (n = 8 rats/group). **p < 0.01 vs. respective CON within each muscle; ##p < 0.01, #p < 0.05 vs. respective NON-HEAT within each muscle; and †p < 0.05 for TEN × HEAT interaction within each muscle.
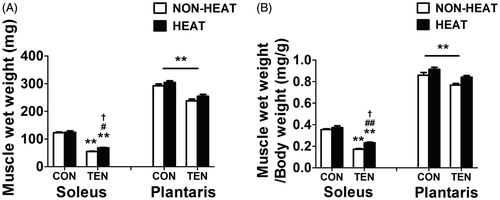
Figure 3. Effects of heat stress and tenotomy on Hsp72 protein expression in soleus and plantaris muscles. (A) Representative Hsp72 protein expression using western blotting. (B) Quantified data of Hsp72. Hsp72 band density was normalised with α-tubulin (n = 8 rats/group). ##p < 0.01 vs. respective NON-HEAT within each muscle.
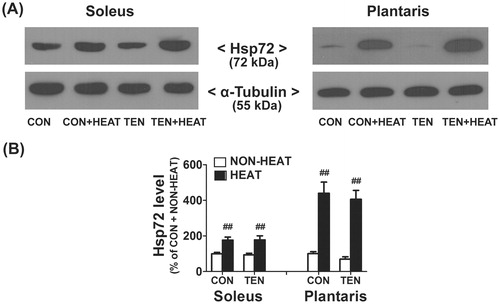
Figure 4. Effects of heat stress and tenotomy on muscle morphology and fibre cross-sectional area (CSA) in soleus and plantaris muscles. (A) H&E staining of muscle cross-sections. Control (CON) and control with heat stress (CON+HEAT) muscles showing typical intact myofibres; tenotomised muscle (TEN) showing evidently variable sizes of myofibres and numerous inflammatory cells (white arrow) accumulation surrounding myofibres and extracellular space; muscle after tenotomy combined with heat stress (TEN+HEAT) illustrating few number of inflammatory cells infiltration. Scale bars = 50 µm; 200 × magnification and 1000 × magnification in insets. (B) Histogram of fibre CSA distribution (a total of 1906 fibres from CON, 1669 fibres from CON+HEAT, 1847 fibres from TEN, and 2042 fibres from TEN+HEAT of soleus muscle; 1884 fibres from CON, 1799 fibres from CON+HEAT, 2141 fibres from TEN, and 1870 fibres from TEN+HEAT of plantaris muscle). (C) Mean fibre CSA (n = 5 rats/group). **p < 0.01 vs. respective CON within each muscle.
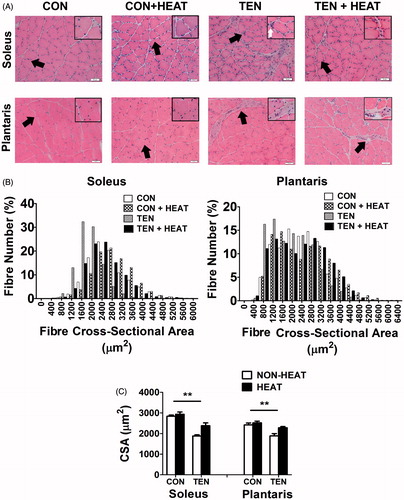
Figure 5. Effects of heat stress and tenotomy on intramuscular collagen accumulation in soleus and plantrais muscles. (A) Picrosirius red-stained collagen fibres of control (CON), control with heat stress (CON+HEAT), tenotomy (TEN), and tenotomy combined with heat stress (TEN+HEAT), muscle fibres were stained with yellow, whilst collagen fibres were stained red. Scale bars = 100 µm. (B) Percentage of collagen area fraction (n = 4 rats/group). **p < 0.01 vs. respective CON within each muscle; ##p < 0.01 vs. respective NON-HEAT within each muscle; and ††p < 0.01 for TEN × HEAT interaction within each muscle.
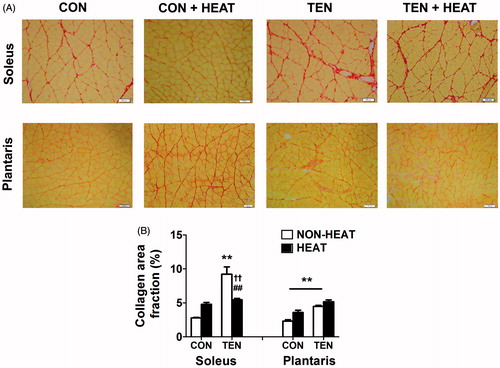
Figure 6. Effects of heat stress and tenotomy on type I collagen protein expression in soleus and plantaris muscles. (A) Representative type I collagen protein expression using western blotting. (B) Quantified data of type I collagen. Type I collagen band density was normalised with GAPDH (n = 5–6 rats/group). *p < 0.05 vs. respective CON within each muscle.
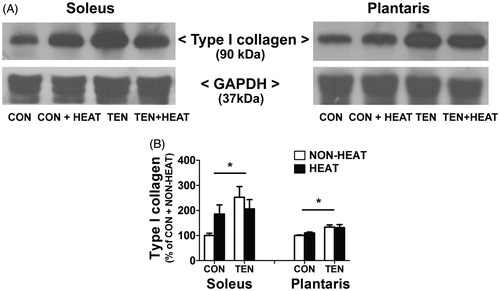
Figure 7. Effects of heat stress and tenotomy on laminin content in soleus and plantrais muscles. (A) Immunofluorescence staining of laminin of control (CON), control combined with heat stress (CON+HEAT), tenotomy (TEN), and tenotomy combined with heat stress (TEN+HEAT). Scale bars = 50 µm. (B) Fluorescence intensity of laminin (n = 3–4 rats/group).
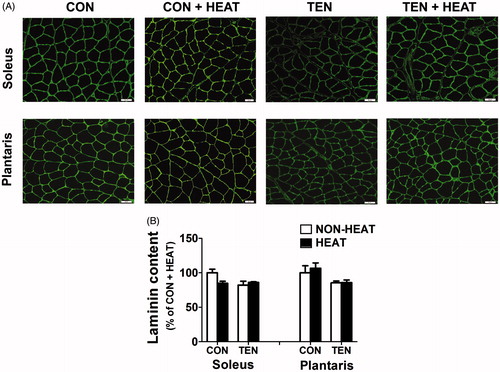
Figure 8. Effects of heat stress and tenotomy on MMP-2 activities and TIMP-2 protein expression in soleus and plantaris muscles. (A) Representative MMP-9 and MMP-2 activities evaluated by gelatin zymography which determines the ability of MMPs to degrade gelatin substrate. (B) Quantified data of active form of MMP-2 and pro (latent) form of MMP-2 band density. (C) Representative TIMP-2 protein expression evaluated by western blotting. (D) Quantified data of TIMP-2. TIMP-2 band density was normalised with α-tubulin (n = 8 rats/group). **p < 0.01 vs. respective CON within each muscle, and †p < 0.05 for TEN × HEAT interaction within each muscle.
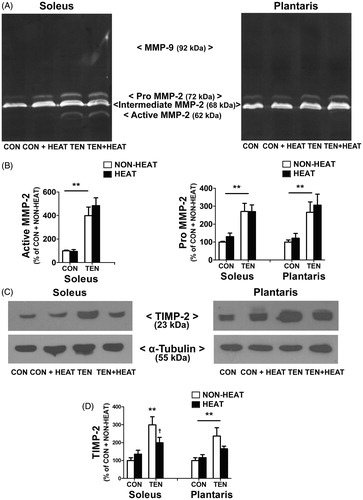
Figure 9. Effects of heat stress and tenotomy on TGF-β1 protein expression in soleus and plantaris muscles. (A) Representative active (25 kDa) and latent (45 kDa) TGF-β1 protein expressions using western blotting. (B) Quantified data of active TGF-β1 and latent TGF-β1. TGF-β1 band density was normalised with GAPDH (n = 6–8 rats/group). **p < 0.01 vs. respective CON within each muscle; ##p < 0.01 vs. respective NON-HEAT within each muscle; and ††p < 0.01 and †p < 0.05 for TEN × HEAT interaction within each muscle.
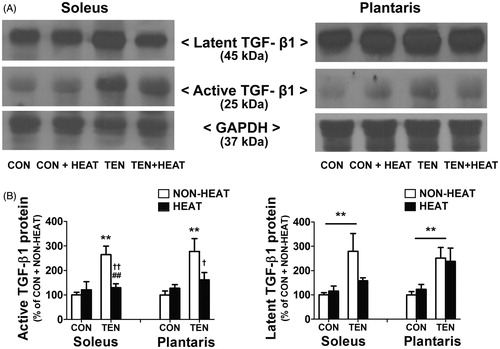
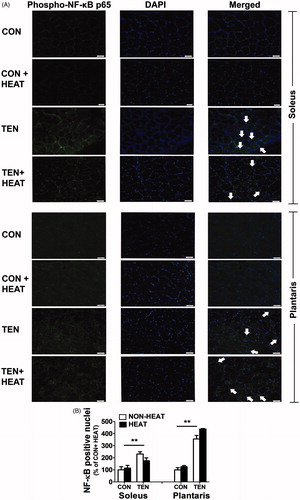
Figure 10. Effects of heat stress and tenotomy on NF-κB translocation in soleus and plantrais muscles. (A) Immunofluorescence staining of phospho-NF-KB p65 (green) and DAPI (blue). Left panels, phospho-NF-κB p65 staining; middle panels, DAPI; right panels, merged image of phospho-NF-KB p65 and DAPI. The presence of NF-κB in the nucleus is indicated by arrows. Scale bars = 50 µm. (B) The number of NF-κB positive nuclei was normalised with total nuclei (n = 3–4 rats/group). **p < 0.01 vs. respective CON within each muscle.