Figures & data
Figure 1. The experimental apparatus was assembled from an ultrasonic thermal therapy transducer (A), which transmitted waves through a focusing lens (B) such that its focus zone would be located at the mid depth of the fat specimen (C). A vertical slider (D) mounted on a lateral slider (E) was used to position the probe (F) at the focal zone.
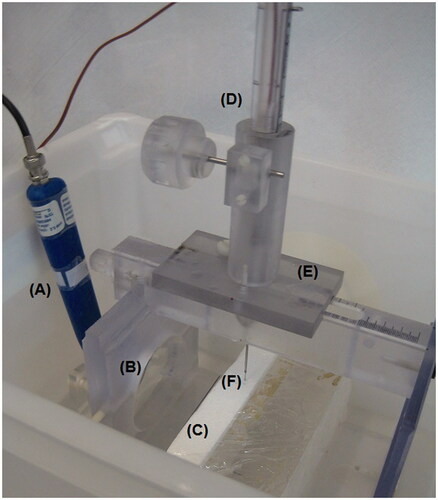
Figure 2. Schematic illustration of the indices, found from the HU vs. temperature plot: (A) depicts the total HU range; (B) depicts the maximal HU disparity; and (C) depicts the indentation depth, which is the difference between the minimal value and the value at the end of the heating. The enclosed region between the heating and post-ablation trajectories is shaded.
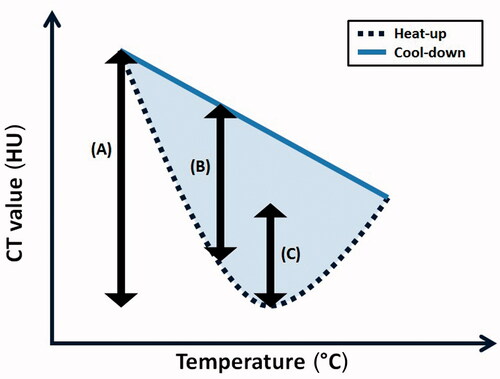
Figure 3. An example of HU versus time curve measured on ex vivo porcine fat tissue during heating and cooling post-ablation stages and its matching temperature versus time profile measured under the same conditions. The error bars represent the standard deviation around the average value.
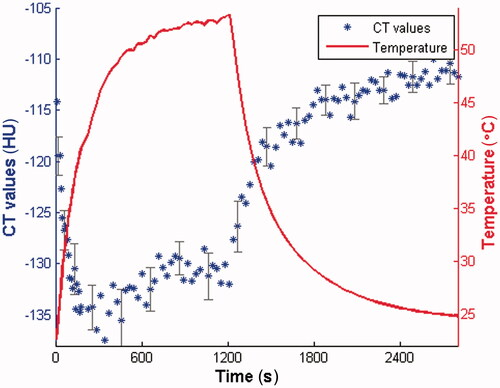
Figure 4. HU versus temperature curves obtained for each of the six specimens studied. For clarity, arrows indicating the time progression are depicted in the bottom right figure. Note the non-linear behaviour in the heating stage and the linear behaviour of the post-ablation stage. The vertical line indicates the maximal discrepancy between heating and post-ablation values.
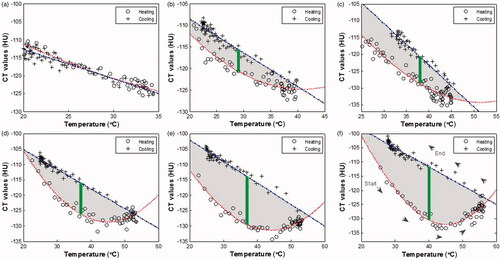
Figure 5. Heating curves of specimens that were heated beyond hyperthermic injury point demonstrate a non-monotonic behaviour, with a minimum at about 44.5 °C.
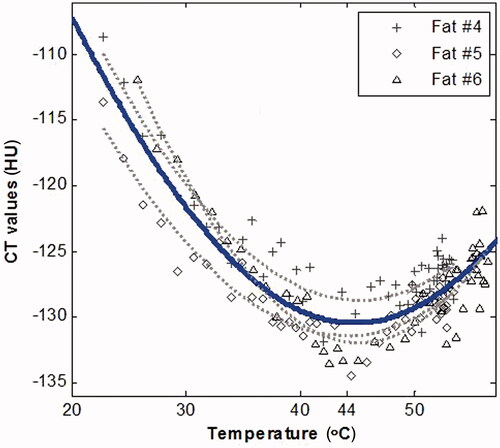
Figure 6. CT image with thermal mapping at different progressive times during the heating phase where darker (colour) pixels represent temperature above 18 °C and pixels below that are shown in (lighter) greyscale. (The low temperature is due to the refrigerated storage of the fat). The first image (top left) was acquired 18 s after HIFU activation. The time interval between the images is approximately 2.5 min (top-left corner to bottom-right corner). The black bar is 5 mm.
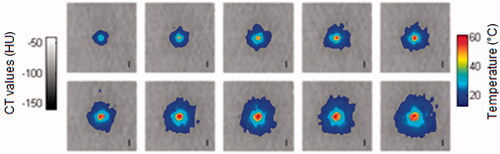
Table I. Summary of the quantified results of fatty tissues damage, for each of the suggested methods.
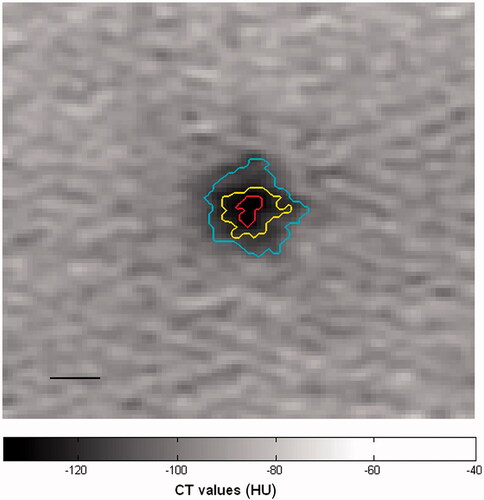
Figure 7. The HU-time profiles demonstrate the indentation depth that occurs at about 44.5 °C. The end of heating and the instant when a temperature of 44.5 °C was reached are marked in both HU and temperature profiles. The vertical red line measures the indentation depth magnitude.
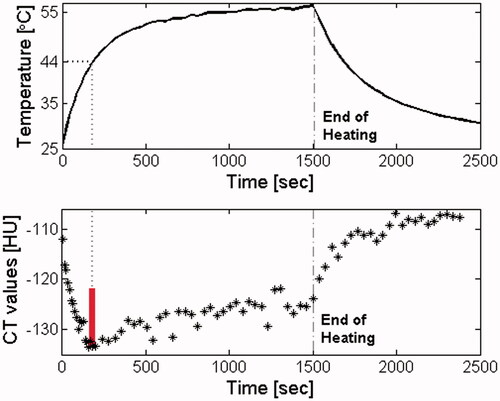
Figure 8. Illustration of overlay damage level of the fat tissue on top of the CT image. The indentation depth index was calculated for each pixel around the focal zone of a CT image, obtained immediately after HIFU treatment termination, regardless of the temperature data. The results were analysed and transformed into three levels, as assessed by the indentation depth index values, marked by three contours. Each contour represents an area with a different level of tissue damage, where the most inner contour (red) indicates higher estimated damage level. The black bar is 5 mm.