
Figures & data
Table I. Primer sequences for candidate reference genes.
Table II. Candidate reference genes evaluated in this study.
Figure 1. Overall RNA transcription patterns of candidate reference genes under different thermal environments and culture systems. The box and whisker diagrams show the quantification cycle (Cq) values for each gene. The band inside each box represents the median Cq, while the bottom and top are the first and third quartiles, respectively. The lines extending from each box (whiskers) indicate the maximum and minimum values.
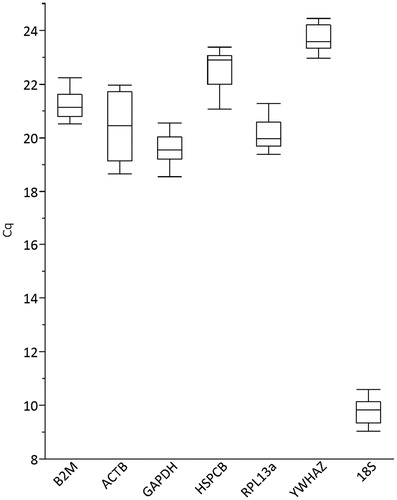
Figure 2. Effect of temperature and culture conditions on RNA transcription profiles of the candidate reference genes. The dots represent the Cq values of genes across different subgroups. Each curve is a cubic spline with a default lambda of 0.05 and standardised X-value.
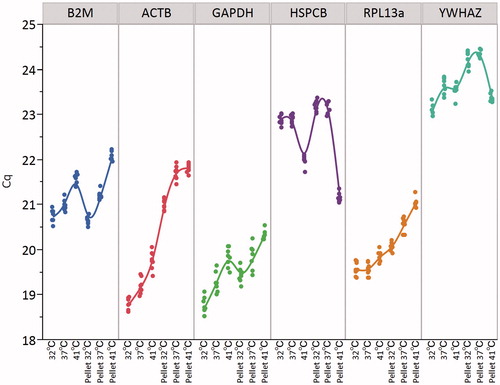
Figure 3. Inter-subgroup variation in monolayer culture determined using NormFinder. The standard deviation (SD) of each candidate reference gene among different subgroups in monolayer culture is shown. The intra-subgroup SD is indicated by the vertical bars.
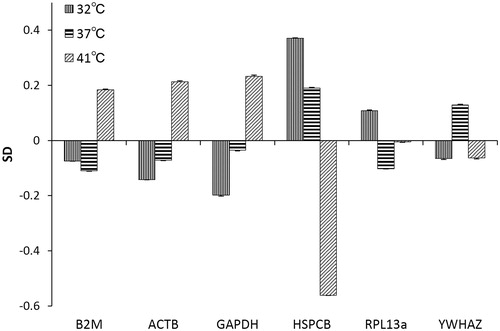
Table III. Stability values and ranking of candidate reference genes obtained using different normalisation softwares.
Table IV. Two-gene combinations with the highest stability values (in parentheses) obtained using NormFinder.
Table V. Repeated pair-wise correlation among reference genes in monolayer culture based on BestKeeper analysis.