Figures & data
Figure 1. Schematic depiction of the experimental design.
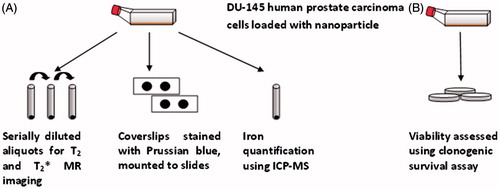
Figure 2. Comparison of amplitude-dependent SLP across peak-to-peak field amplitude spectrum among tested nanoparticle formulations. SLP values for Feridex were obtained from Bordelon et al. [Citation6], and are provided for comparison. Error bars represent standard deviation of the mean calculated from three measurements. AMF frequency was 155 ± 10 kHz.
![Figure 2. Comparison of amplitude-dependent SLP across peak-to-peak field amplitude spectrum among tested nanoparticle formulations. SLP values for Feridex were obtained from Bordelon et al. [Citation6], and are provided for comparison. Error bars represent standard deviation of the mean calculated from three measurements. AMF frequency was 155 ± 10 kHz.](/cms/asset/1a6686c1-a127-4916-9398-727ae3cdbd54/ihyt_a_913321_f0002_b.jpg)
Table I. Physical parameters of MNPs used in the current study.
Figure 3. Prussian blue stained slides of nanoparticle loaded DU-145 cells. Images were obtained after 24 h incubation with (A) D-SPIO, (B) JHU, (C) Feridex, and (D) BNF.
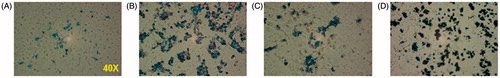
Figure 4. Survival fraction of DU-145 cells at 100 pg Fe/cell loading. Cells were incubated 24 h with various nanoparticle formulations.
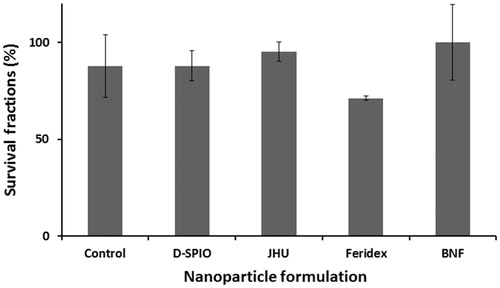
Figure 5. Analysis of DU-145 cell-NP loaded iron concentration using ICP-MS. Aliquots ranged from 5 × 10⁵ to 1.1 × 10⁶ cells. Absolute iron concentration was calculated based on known cell number (pg Fe/cell).
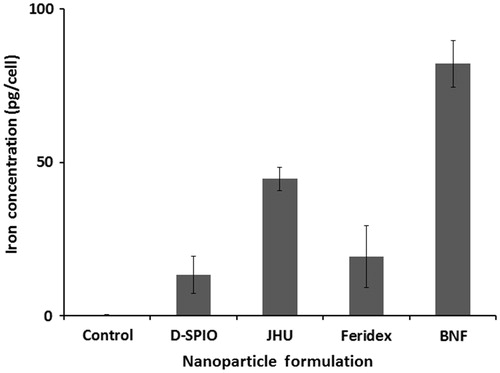
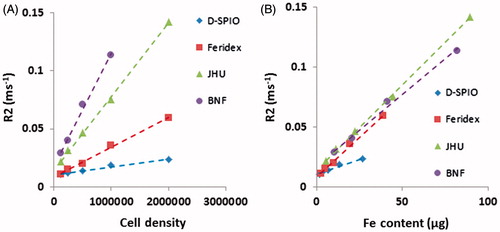
Figure 6. T2 relaxation rates (R2) of DU-145 nanoparticle loaded cells as a function of (A) cell number and (B) total iron concentration.