Figures & data
Figure 1. (A) 3D cad of the PMMA mask; (B) schematic representation of the top view of the PMMA mask. The holes designed to insert the thermocouples during the experiments and their distances to the hole used to insert the applicator are shown; (C) picture of the pancreas after the insertion of the thermocouples and the laser applicator thanks to the PMMA mask.
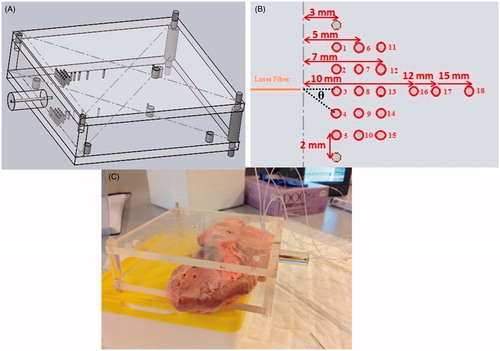
Table 1. Values of d and θ for the 18 holes (12 different positions).
Figure 2. Temperature within panceras measured by thermocouple during 20 cycles of laser turned on and off at P = 2 W. Thermocouple inserted in the hole 8 (d = 5 mm, and θ = 0°) shows high artefact, thermocouple inserted in the hole 5 (d = 5 mm, θ = 53.1°) show low artefact.
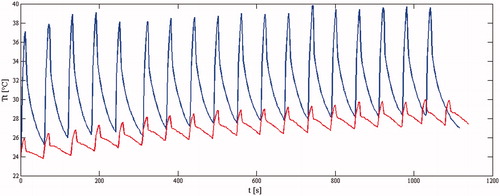
Table 2. Values of artefact magnitude at the two laser powers and at the 12 positions.
Figure 3. Artifacts amplitude vs. d at θ = 0°. Experimental data (dots) and best exponential fitting (dashed line) at P = 1.6 W; Experimental data (asterisks) and best exponential fitting (continuous line) at P = 2.0 W.
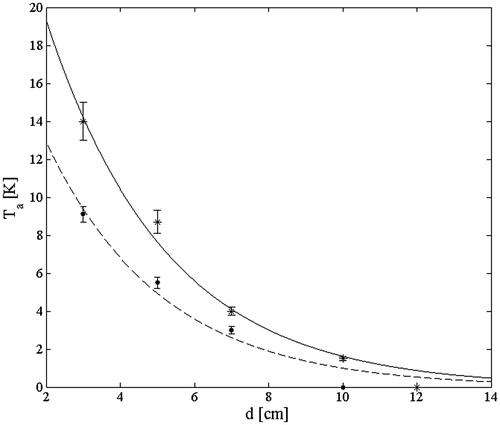
Figure 4. Artifacts amplitude vs. d and θ. The good agreement between the three-variables model and the experimental data allows to minimize the error of measured temperature during laser irradiation.
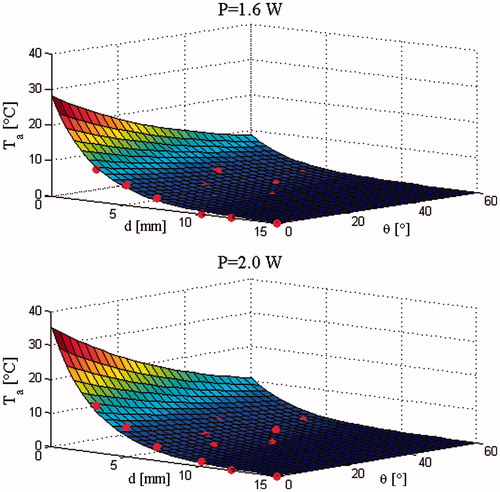
Table 3. Values of constants obtained by fitting experimental data with Equation 6. Also R2, the maximum artifacts amplitude, and the maximum difference (εT) between the experimental values of Ta and theoretical ones are reported.
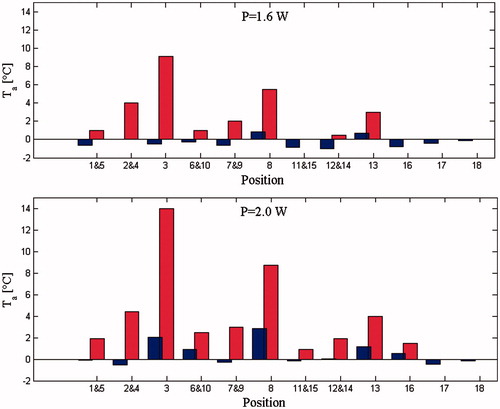
Figure 5. Artefacts with and without correction at 1.6 W and 2.0 W. Each couple of bars shows the artifacts without correction (right and higher bar) and with correction (left and smaller bar). In all the twelve positions the artefact is bigger without correction, see Table 2.