
Figures & data
Table 1. Summary of baseline characteristics.
Table 2. Summary of study treatment.
Table 3. Combined summary of grade 3–4 adverse events. (Subjects are counted only once within each system-organ class and preferred term, at the highest severity grade experienced. N = 29.).
Figure 1. Pharmacokinetic profiles for cycles 1 and 2 at each dose level for doxorubicin and its cardiotoxic metabolite, doxorubicinol. The half-life of the drug was the same for cycle 1 and cycle 2 and was not dependent upon doxorubicin dose.
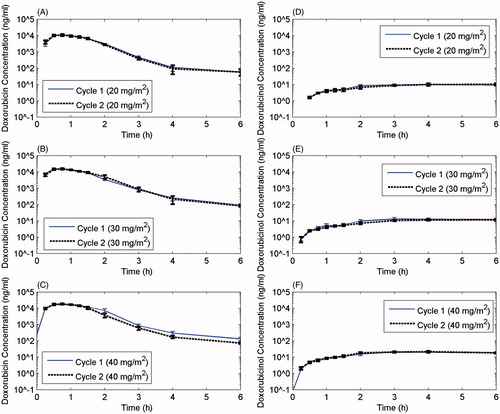
Table 4. Total doxorubicin and doxorubicinol plasma PK parameters for LTLD – Trial A.
Figure 2. Evaluation of treatment course for a patient who achieved a complete response. (A) Photo of thermometry placement, and (B) position of the 18 × 10 cm applicator over the lesion. This lesion was treated in a single field using this applicator. The 25% isoSAR line encompassed the tumour region. (C) Appearance of the involved region prior to initiation of treatment. The margins of the tumour are easily seen by the red colour against the normal skin. (D) Appearance of the tumour area prior to cycle 3. The patient had achieved a partial response by this time point. (E) Thermographic camera image of chest well shows temperature distribution on the surface of the tumour region, prior to therapy. (F) Thermographic image of the chest wall prior to cycle 4 shows reduced surface temperature compared with baseline. (G) Thermographic images of the chest wall prior to cycle 5. By this time, the temperature of the involved region had reduced by 1 °C. This was most likely the result of reduced perfusion and metabolism, associated with tumour regression. This patient went on to achieve a complete response (not shown).
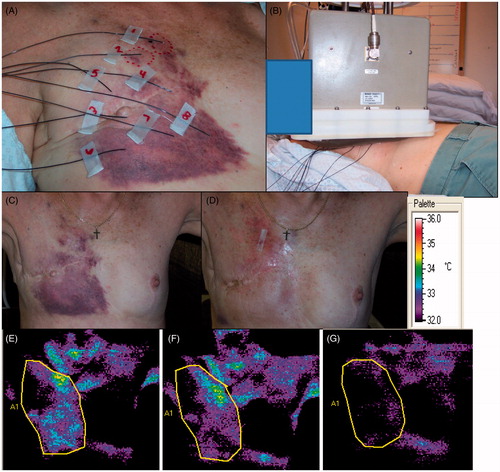
Table 5. Efficacy: Local objective response.
Table 6. Efficacy: Local objective response rates in the combined trials.