Figures & data
Figure 1. (A) The change in the colour of silver solutions as the synthesis proceeds over time. (B) The corresponding absorption shift for the silver solution as it evolves in time.
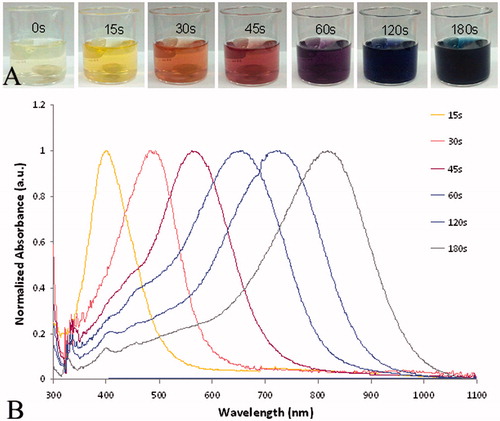
Figure 2. Electron microscopy image of the silver nanoparticles synthesised for use as photothermal agents. (A) Seed, which is mostly spherical and (B) triangular plates.
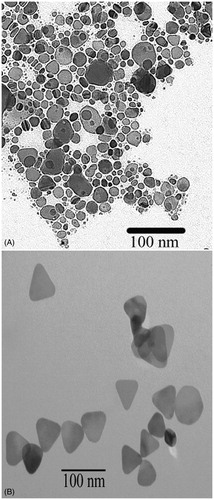
Figure 3. The silver nanoparticles are stable in water over a 7-day period, as observed by measuring shifts in the optical spectrum each day and by observing that no precipitation on the nanoparticles occurred as shown in the inset in the figure. Day 0, 792 nm; day 1788 nm; day 2, 782 nm; day 3, 780 nm; day 4, 776 nm; day 5, 774 nm; day 6, 774 nm; day 7, 774 nm; total shift is 18 nm and then it stabilised at day 5, with no further shifting. a.u.: Arbitrary units.
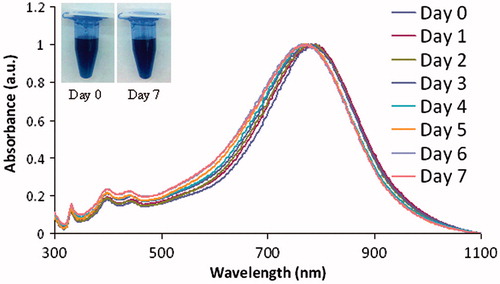
Figure 4. Absorbance at 800 nm, corresponding to the concentration of Ag NP. AU: Arbitrary units.
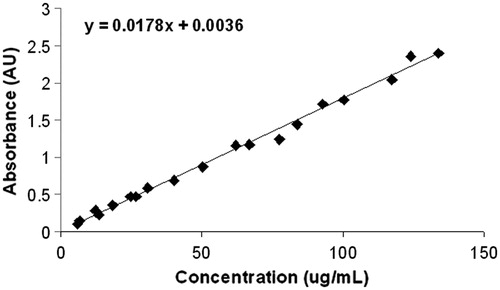
Figure 5. Temperature change versus concentration of silver nanoparticles designed specifically to absorb near 800 nm. This reflects the temperature change of a 500-μL volume, with an 800 nm diode laser, spot size of 3.8 cm2, applied at 3 W, CW for 60 s. The optimal concentration for heating is below the plateau, between 5–50 μg/mL, where a sufficient temperature change of 5–35 °C occurs.
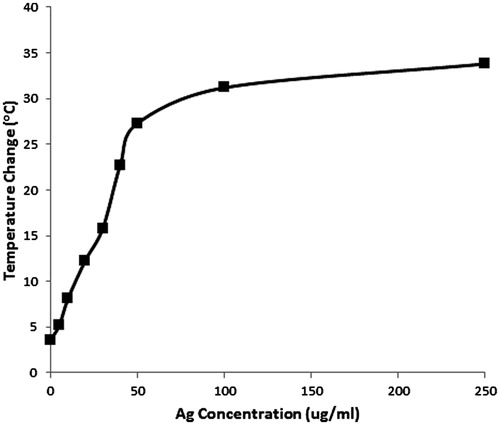
Figure 6. Semi-log plots of the survival fraction of MCF 10A, MCF7 and MDA-MB-231 cells to hyperthermia between 40° and 50 °C for 0 to 300 min. MCF7 cells appear to have the greatest resistance to hyperthermia, as indicated by the higher surviving cell fraction at 47 °C compared to MCF 10A and MDA-MB-231 cells. MDA-MB-231 cells succumb to hyperthermia beginning at 45 °C, suggesting that this cell line may be more sensitive to hyperthermia than either MCF 10A or MCF7 cells.
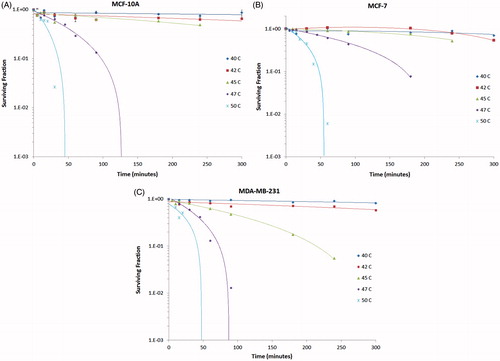
Figure 7. (A) MTS assay of cell viability of the breast cell lines exposed to Ag NP for 24 h indicates an approximate 20–30% reduction in viable cells upon exposure to the low amount, 5 μg, of Ag NP, with an increase in viability between 20–40 μg/mL, especially for the MCF 10A line. A progressive decrease in cell viability is observed for all cell lines as the silver nanoparticle concentration increases above 50 μg/mL, with MCF 10A cells being the most resistant to silver cytotoxicity, followed by MCF-7, then MDA-MB-231 cells. Concentration, cell type, and the interaction of the two factors are each significant on a p < 0.001 level. Both cancer cell lines are significantly different from the MCF 10A cells at each concentration of 20 μg/mL or higher. (B) Clonogenics assay of breast cells incubated with varying concentrations of Ag NP for 24 h indicate a lower cytotoxicity threshold for all other the cell lines. MCF 10A have increased colony numbers at 10 µg/mL of Ag NP. MDA-MB-231 cells are the most susceptible to Ag NP, with a 50% reduction at the lowest concentration and no colonies formed upon exposure to 20 µg/mL or higher concentrations. (C) Lactate dehydrogenase released from the cells decreases progressively upon incubation of the cells with Ag NP. There is significantly less LDH released by MCF7 and MDA-MB-231 cells, compared to MCF 10A cells at 100 and 250 µg/mL. All images were taken at 20× magnification. There are slight reductions in the size of the nuclei of MCF 10A and MCF7 cells treated for 24 h with 50 µg/mL of Ag NP, although this is not observed in the MDA-MB-231 cells.
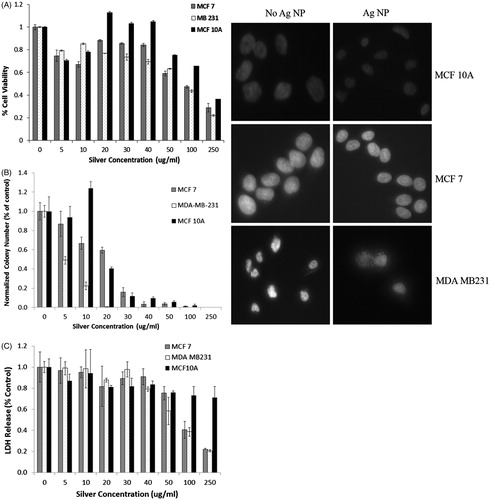
Figure 8. Cell viability of the breast cancer cell lines incubated for 10 min only with increasing concentrations of silver, and infrared light exposure for 60 s. Cell viability was determined to be 100% for the control population of each cell line not exposed to either silver nanoparticles or infrared light, and the fractional viability is what is presented in this plot. (A) MTS assay results of cell viability measured 24 h after photothermal treatment. At 5 and 10 μg/mL, MCF7 cells have a slight increase in cell proliferation compared to the control. As the concentration of Ag NP increases, there is a decrease in the number of viable cells after exposure to 800 nm light. A small percentage of MCF7 cells remains viable after photothermal treatment at the highest concentrations of 100 and 250 μg/mL. (B) Clonogenics assay results show that at low concentrations of Ag NP, 5 and 10 μg/mL, MCF 10A cells had a higher percentage of colonies formed compared to cells without Ag NP and laser exposure. There is a decrease in the number of colonies formed for MCF7, MDA-MB-231 and MCF 10A cell lines as the Ag NP concentration increases. For concentrations of 40 μg/mL and higher, the MCF 10A cells have a statistically greater number of colonies forming 12 days after photothermal treatment compared to the MCF7 and MDA-MB-231 cell lines. (C) The amount of LDH released from cells 24 h after photothermal treatment using Ag NP does not show much of an increase until 250 μg/mL of Ag NP. At this concentration, both MDA-MB-231 and MCF 10A cells have an increased release of LDH, whereas MCF7 cells have a constant level of LDH released among all the concentrations of Ag NP evaluated.
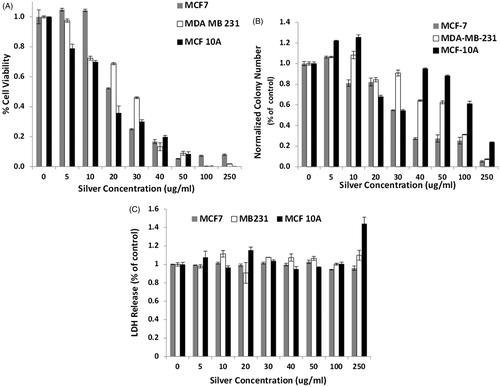
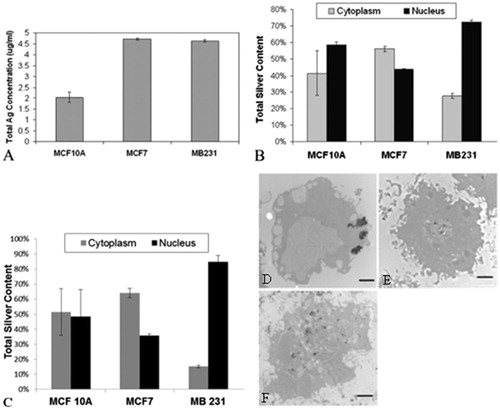
Figure 9. (A) The total amount of intracellular silver for each of the breast cell lines was evaluated by ICP mass spectroscopy. Notably, MCF7 and MDA-MB-231 cell lines have approximately the same amount of intracellular silver and MCF 10A have much less. The MCF 10As are significantly different on a p < 0.001 level from the other two cell lines, which are not different from each other. From this information we can calculate the total amount of intracellular silver delivered by the Ag NP using the experimental parameters of 4 mL total volume for ICP analysis and 3 000 000 cells total. (B) Cell populations for each of the breast cell lines were fractionated to evaluate the total silver content present in either the nucleus or cytoplasm using ICP-OES. MCF7 cells have about the same silver concentration in the nucleus or cytoplasm, whereas both the MCF 10A and MDA-MB-231 cells have a much higher proportion of silver (72–82%) in the nucleus compared to the cytoplasm. The nuclear fraction is significantly different in the MCF7 and MDA-MB-231 cells on a p < 0.001 level relative to the MCF 10A cells. However, the cytoplasmic fraction of either cancer cell line is not different from the MCF 10A cells. (C) Cytoplasmic and nuclear cell fractions were evaluated by UV-Vis spectroscopy to determine the intracellular location of silver nanoparticles. MCF 10A has about the same amount of Ag NP in the cytoplasm as the nucleus. MCF7 cells have more Ag NP in the cytoplasm than the nucleus, which is opposite to the results from MDA-MB-231 cells, which have much more Ag NP in the nucleus than the cytoplasm. (D) The representative TEM image of MCF7 cell shows that Ag NP tend to be concentrated in the cytoplasm. (E) The representative TEM image of MDA-MB-231 cells shows that Ag NP tend to localise to the nucleus and are not found throughout the rest of the cell. (F) The representative TEM image of MCF 10A cells shows that Ag NP are located throughout the cell, in both the cytoplasm as well as the nucleus. Scale bars for images D–F are 2 µm.