Figures & data
Figure 1. Geometry of tumour and different layers of skin. (A) y–z view of tumour with respect to stratum corneum and epidermis (SC-ED), dermis (D), subcutaneous fat (SF) and subcutaneous tissue (ST) layers, (B) 3D geometry of model.
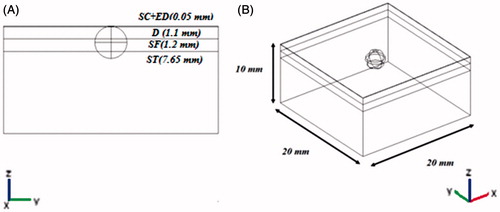
Figure 2. 3D configurations of different electrode geometry with respect to tumour and a four-layer skin model. (A) 2-electrode geometry, (B) 4-electrode geometry, (C) hexagonal geometry.
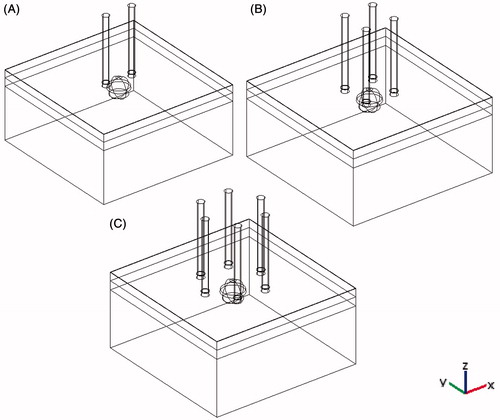
Table 1. Electrical and thermal properties of different tissues and electrodes used in simulations.
Figure 3. Polarity of different electrode configurations and simulation parameters. (A) 2-electrode configuration, (B) 4-electrode configuration, (C) hexagonal 2 × 2 electrode configuration, (D) hexagonal 3 × 3 electrode configuration, (E) central y–z view of model and other geometric parameters.
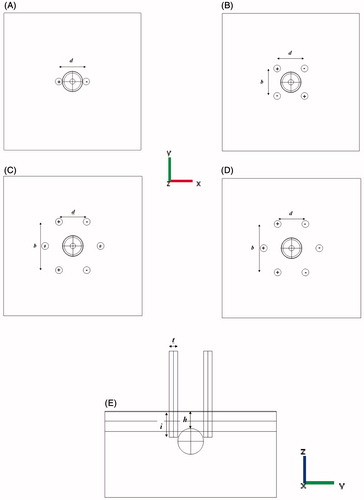
Table 2. Applied parameters in study, their step and base value.
Table 3. Number of elements for all electrode geometries. Number of elements in this table is for base value of geometric parameter.
Figure 4. Relative irreversibly electroporated volume for normal and tumour tissue by distance between contrary electrodes (d).
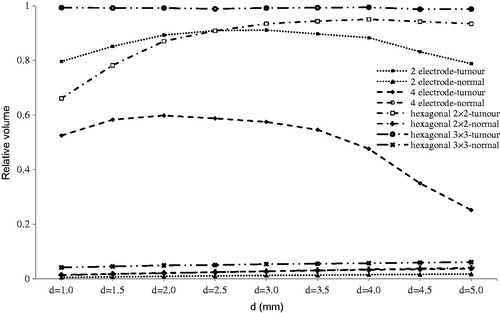
Figure 5. Relative irreversibly electroporated volume for normal and tumour tissue distance between adjacent electrodes (b).
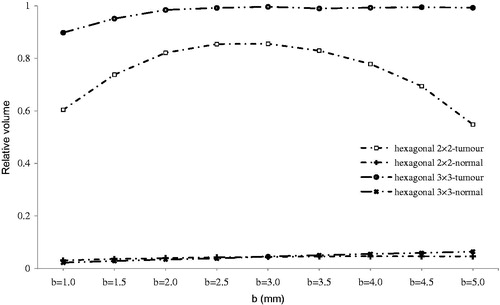
Figure 6. Relative irreversibly electroporated volume for normal and tumour tissue by electrode insertion (i).
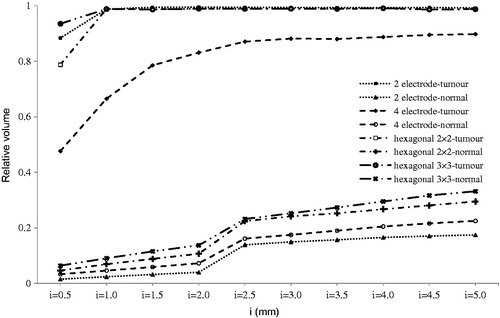
Figure 7. Relative irreversibly electroporated volume for normal and tumour tissue by electrode thickness (t).
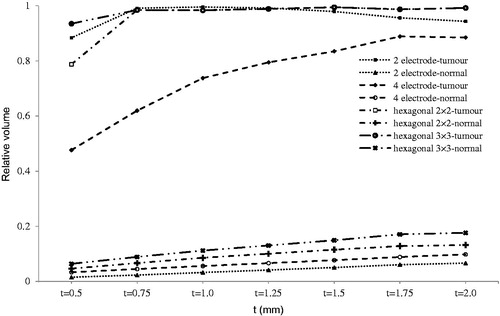
Figure 8. Relative irreversibly electroporated volume for normal and tumour tissue by tumour depth (h).
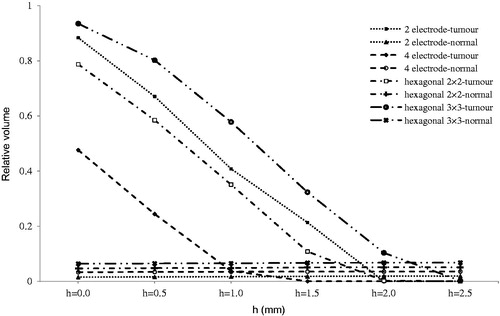
Figure 9. Relative irreversibly electroporated volume for normal and tumour tissue by voltage (v).
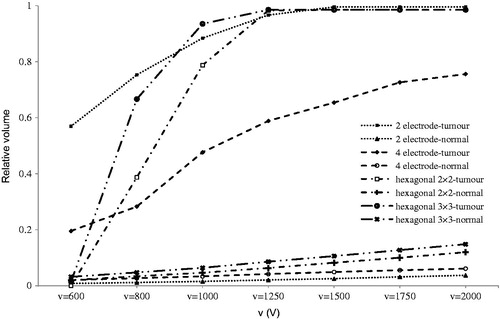
Figure 10. The effect of electrode insertion on electric distribution in tumour and normal tissue for 4-electrode configuration. (A) i = 0.5 mm, y–z view, (B) i = 0.5, x–y view, (C) i = 5 mm, y–z view, (D) i = 5 mm, x–y view. The effect of electrode insertion on irreversibly electroporated volume is obvious especially on normal tissue.
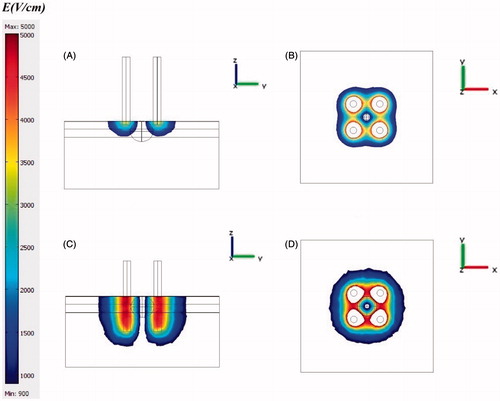
Figure 11. Logarithm of thermal damage on normal and tumour tissue by distance between contrary electrodes (d).
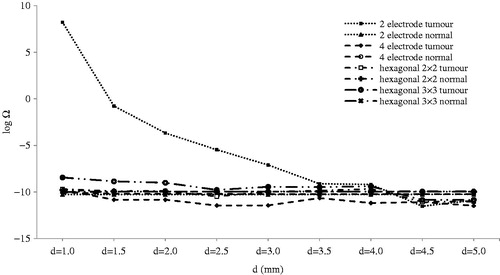
Figure 12. Logarithm of thermal damage on normal and tumour tissue by distance between adjacent electrodes (b).
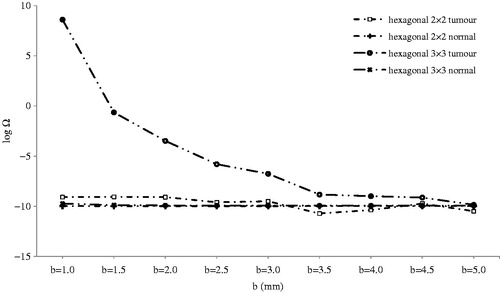
Figure 13. Logarithm of thermal damage on normal and tumoral tissue by electrode insertion (i).
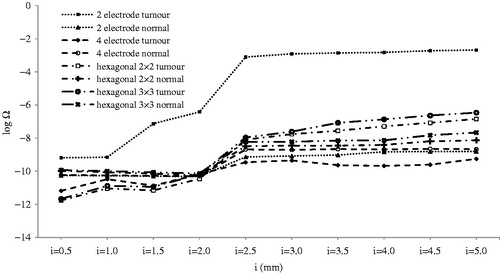
Figure 14. Logarithm of thermal damage on normal and tumour tissue by electrode thickness (t).
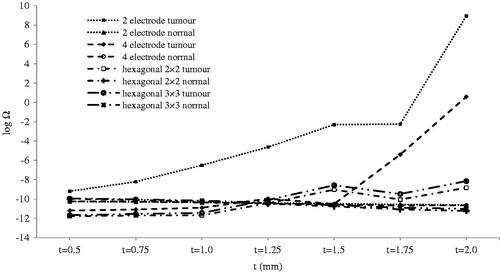
Figure 15. Logarithm of thermal damage on normal and tumour tissue by tumour depth (h).
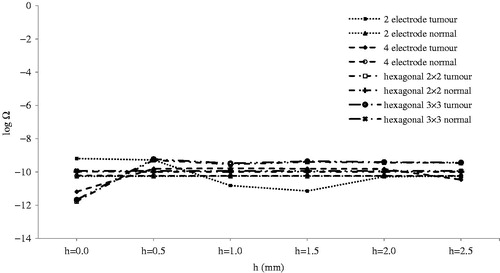
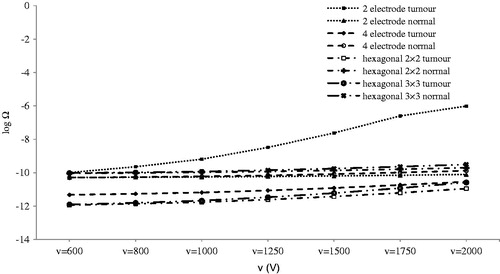
Figure 16. Logarithm of thermal damage on normal and tumour tissue by voltage (v).