Figures & data
Table 1. Survival analysis for the different treatment groups.
Figure 1. Growth delay of the primary and secondary side as a function of relative intratumoural DOX measured with optical spectral imaging at 6 h (A), 12 h (B), and 24 h (C) after treatment. Data is given as mean and SEM for each group (n = 19, 20, 28, 26, 5, and 5 animals for control, DOXIL, LTSL1 with 3.8% PEG, LTSL2 with 5.2% PEG, LTSL1 (7.5 mg/kg) with 3.8% PEG, LTSL2 (7.5 mg/kg) with 5.2% PEG, respectively).
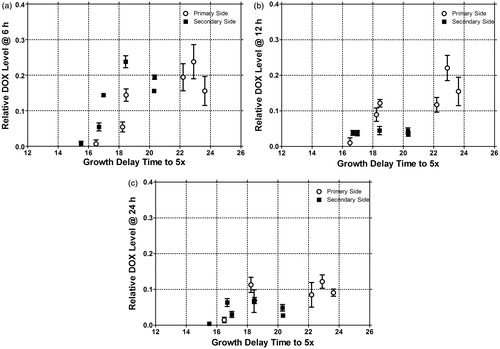
Figure 2. Primary treated side relative DOX level versus time (a). Secondary treated side relative DOX level versus time (b). Data is given as mean for each group (n = 19, 20, 28, 26, 5, and 5 animals for control, DOXIL, LTSL1 with 3.8% PEG, LTSL2 with 5.2% PEG, LTSL1 (7.5 mg/kg) with 3.8% PEG, LTSL2 (7.5 mg/kg) with 5.2% PEG, respectively).
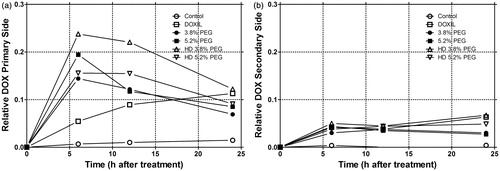
Table 2. DOX accumulation results. Normalised area under the curve (AUC) and peak concentration for each treatment group and tumour side (Primary had local HT).
Figure 3. a and b demonstrate the mean temporal relationship for each treatment group of NAD(P)H after therapy for the primary side (a) and the secondary side (b). c and d demonstrate the mean percentage change of the NAD(P)H of each treatment group versus tumour growth delay of both the primary and secondary side at 6 h (c) and 12 h (d) with linear regression and 95% confidence bounds. At 6 h the results were statistically significant (n = 19, 20, 28, 26, 5, and 5 animals for control, DOXIL, LTSL1 with 3.8% PEG, LTSL2 with 5.2% PEG, LTSL1 (7.5 mg/kg) with 3.8% PEG, LTSL2 (7.5 mg/kg) with 5.2% PEG, respectively).
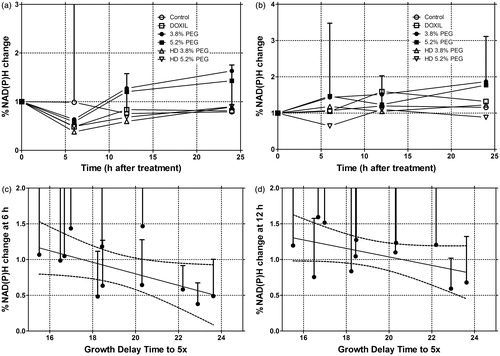
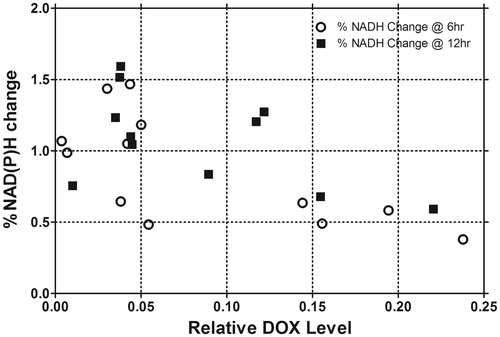
Figure 4. The mean NAD(P)H percentage change for each treatment group versus mean relative DOX concentration for each group at 6 and 12 h combining both treatment sides. Linear regression was then performed demonstrating a significant slope not equal to unity with 95% confidence intervals at 6 h. Note, linear regression overlay was not included, for clarity (n = 19, 20, 28, 26, 5, and 5 animals for control, DOXIL, LTSL1 with 3.8% PEG, LTSL2 with 5.2% PEG, LTSL1 (7.5 mg/kg) with 3.8% PEG, LTSL2 (7.5 mg/kg) with 5.2% PEG, respectively).