
Figures & data
Table 1. Comparison of approximations of two non-invasive MRgFUS thermal diffusivity estimation methods.
Figure 1. Set-up for MRgFUS experiments and orientation of coordinate axes in analytical solutions used for thermal diffusivity estimation.
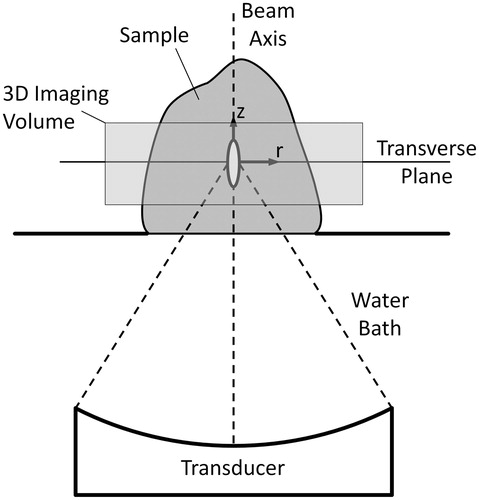
Table 2. Selected ultrasound parameters and temperature information from experimental data.
Figure 2. Representative ex vivo pork muscle experimental temperatures and fits used in thermal diffusivity estimation. (A) Temperature vs. time profile at the centre of the focal zone as well as baseline temperature measurements in a non-heated region 15 mm from the focus. Time is measured from the onset of heating. Arrows identify time points (t1, t2, t3) whose transverse temperature distributions are plotted in B and compared with Gaussian temperature fits to those data. (C) Estimates for 4α t+β vs. time and the linear fit used in the Gaussian temperature method for thermal diffusivity estimation. (D) The temperature vs. time profile at the centre of the focal zone and the corresponding data from the Gaussian SAR/heat and cool temperature fit at that location. Transverse temperature profiles and the Gaussian SAR/heat and cool fit are plotted in E for cooling times t1, t2, and t3 and in F for heating times t4, t5, t6 (indicated by arrows in D).
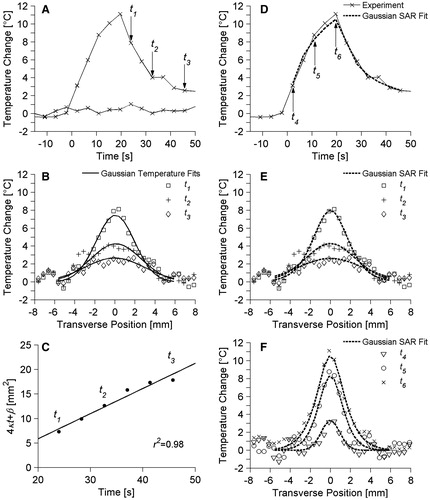
Figure 3. Thermal diffusivity measurements and estimates in four ex vivo pork muscle samples. Invasive measurements (white columns) serve as the reference standard for thermal diffusivity values. Non-invasive MR temperature-based estimates (light grey columns) were repeated multiple times in each sample. Results for the combination of all ex vivo pork muscle experiments are shown in the left column (dark grey) with error bars extending to ± 1 SD from the mean value.
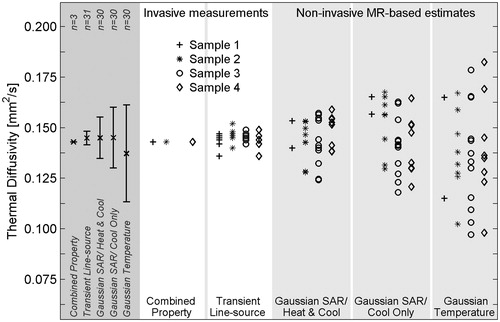
Table 3. Summary of thermal diffusivity measurements and estimates in ex vivo pork muscle experiments. Results are presented as the mean value with SD values in parentheses. Thermal diffusivity units are mm2/s.
Figure 4. Magnitude image in coronal slice at time of maximum heating with temperature change overlay. The animal is supine, slightly oblique, with the head to the right of the image, and the field of view has been truncated to show only the region of interest, including the spine and back muscles. The threshold for temperature display is 2 °C.
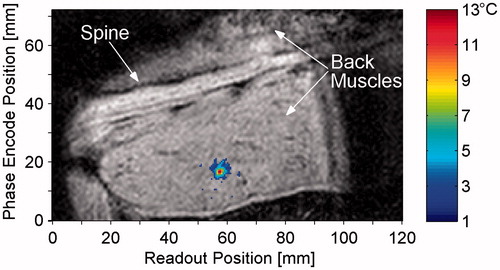
Figure 5. Thermal diffusivity measurements and estimates in in vivo rabbit back muscle. Invasive transient line source measurements (white column) serve as the reference standard and were made at 4–5 locations in the back muscle. Non-invasive MR temperature-based estimates were repeated 6–7 times at two locations in each animal. Two estimates using the Gaussian temperature method in rabbit 1 do not fit within the limits of the plot (α = −0.159, 0.554 mm2/s). Results for the combination of all in vivo experiments are shown in the left column (dark grey) with error bars extending to ± 1 SD from the mean value.
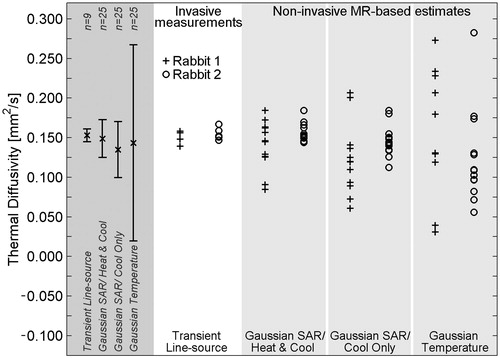
Table 4. In vivo results of thermal diffusivity measurement and estimation in rabbit back muscle presented as the mean value with SD values in parentheses. Thermal diffusivity units are in mm2/s.