Figures & data
Figure 1. Left: Geometry of the computational model for interventricular septum (IVS) ablation. Septum thickness: S. The geometry of the model for ventricular free wall (VFW) ablation was similar, but circulating blood in one ventricle was replaced by pericardial fluid or air. Ventricle dimensions X and Z were obtained from a convergence test. Right: Detail of the electrode on the tissue. Electrode radius: RL = RR = 1.155 mm (7 Fr), electrode lengths: LL = LR = 3.5 mm (0.25 mm thickness wall), and insertion depth: DL = DR = 0.5 mm.
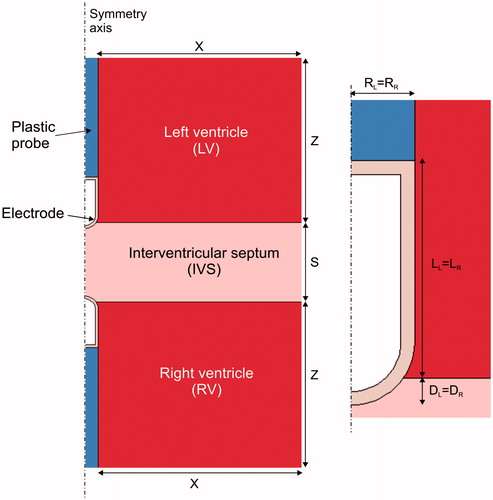
Table 1. Thermal and electrical characteristics of the elements of the numerical models (data compiled from references [Citation21–24]).
Figure 2. Electrical boundary conditions of the model for interventricular septum (IVS) ablation for (A) bipolar mode (BM), (B) sequential unipolar mode (SeUM) and (C) simultaneus unipolar mode (SiUM). (D) Thermal boundary conditions for all cases. hCL = hCR and hEL = hER are the thermal transfer coefficients at the endocardium–blood and the electrode–blood interfaces, respectively.
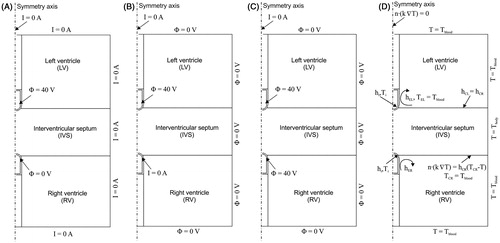
Figure 3. Temperature distribution in the tissue after 120 s of RFA across the interventricular septum (IVS) for different septum thickness from 10 to 15 mm, considering three modes of ablation: (A) bipolar mode (BM), (B) sequential unipolar mode (SeUM), and (C) simultaneous unipolar mode (SiUM). The solid black line is the thermal damage border (Ω = 1). RL: right ventricle, and LV: left ventricle.
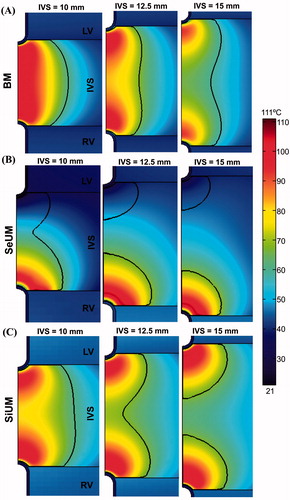
Table 2. Lesion dimensions (in mm) in the interventricular septum (IVS) for different septum thickness and three modes of RF ablation: bipolar mode (BM), sequential unipolar mode (SeUM) and simultaneous unipolar mode (SiUM).
Figure 4. Temperature distribution in the tissue after 120 s of RFA across the ventricular free wall (VFW) with pericardial fluid in the epicardial space, considering different wall thickness from 7.5 to 15 mm and three modes of ablation: (A) bipolar mode (BM), (B) sequential unipolar mode (SeUM), and (C) simultaneous unipolar mode (SiUM). The solid black line is the thermal damage border (Ω = 1).

Table 3. Lesion dimensions (in mm) in the ventricular free wall (VFW) with the epicardial catheter surrounded by pericardial fluid for different wall thickness and three modes of RF ablation: bipolar mode (BM), sequential unipolar mode (SeUM) and simultaneous unipolar mode (SiUM).
Figure 5. Temperature distributions after 120 s of RFA across the VFW (10 mm wall thickness) with the epicardial catheter surrounded by air, considering three modes of ablation: (A) bipolar mode (BM), (B) sequential unipolar mode (SeUM), and (C) simultaneous unipolar mode (SiUM). The solid black line is the thermal damage border (Ω = 1).
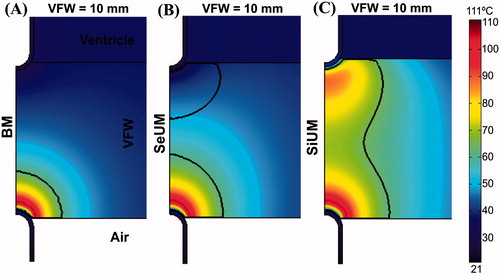
Figure 6. Temperature distributions after 120 s of RFA across the VFW (10 mm wall thickness) with the epicardial catheter placed over a fat tissue layer, considering three modes of ablation: (A) bipolar mode (BM), (B) sequential unipolar mode (SeUM), and (C) simultaneous unipolar mode (SiUM). The solid black line is the thermal damage border (Ω = 1).
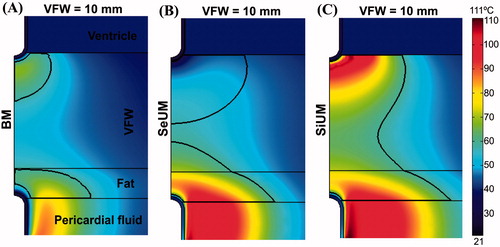
Figure 7. Temperature distributions after 120 s of RFA with BM across VFW (10 mm thickness) comparing two orientations of the epicardial catheter: (A) perpendicular and (B) parallel to the epicardium. The solid black line is the thermal damage border (Ω = 1).
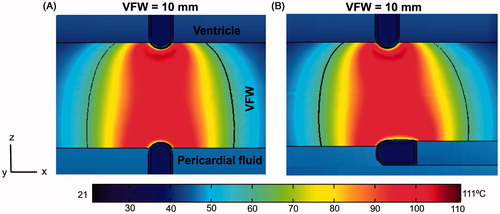
Figure 8. Temperature distributions in the tissue after 120 s of RFA with BM (A) and SiUM (B) across the IVS (10 mm thickness), increasing the misalignment between catheters in steps of 2.5 mm until the lesion was no longer transmural. Note that the lesions were transmural when they reached all the tissue at a plane of the wall, including the center. The solid black line is the thermal damage border (Ω = 1). LV: left ventricle, and RV: right ventricle.
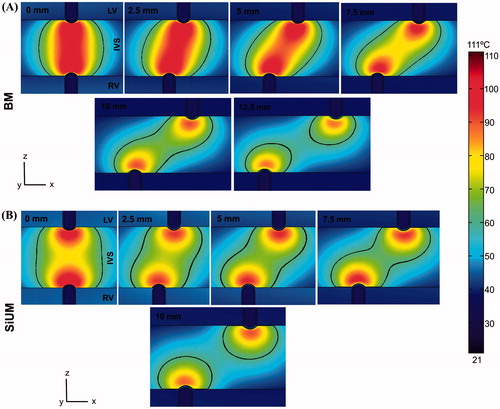
Figure 9. Temperature distributions in the tissue after 120 s of RFA with BM (A) and SiUM (B) across the VFW (10 mm thickness), increasing the misalignment between catheters in steps of 2.5 mm until the lesion was no longer transmural. The solid black line is the thermal damage border (Ω = 1).
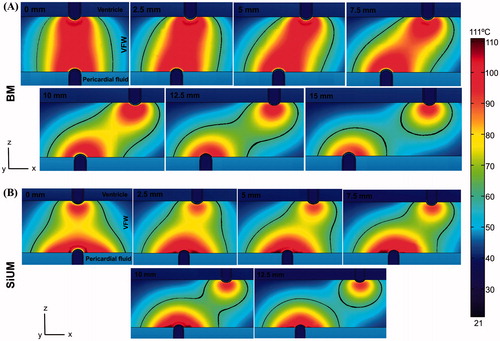
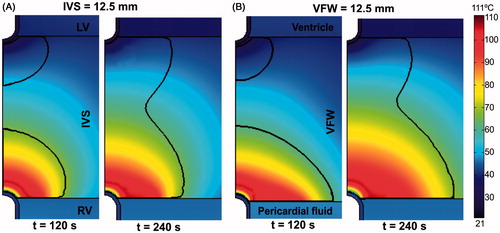
Figure 10. Temperature distributions in the tissue after 120 s and 240 s of RFA with SeUM across the IVS (A) and the VFW (both 12.5 mm thickness). The solid black line is the thermal damage border (Ω = 1).