
Figures & data
Figure 1. (A) PET-CT image from case 1 showing a single peripheral lesion, 40 × 38 mm, in the superior segment of the left lower lobe and with high FDG uptake before MWA. (B) CT scan showing a drainage tube placed in the pleural cavity and microwave antennas used for MWA. (C) At 10 days after tumour ablation, the ablated area, 55 × 50 mm, displaying GGO and mild pleural effusion. (D) At 18 days after tumour ablation, the ablation zone has been replaced by a large thin-walled cavity containing a mass of irregular consolidation with an air crescent sign. (E) Macroscopic appearance of expectoration. (F) Photomicrograph of expectoration revealing numerous Aspergillus hyphae (×40, haematoxylin and eosin staining). (G) A contrast-enhanced CT scan at 7 weeks after MWA showing a thin-walled cavity with a smooth lining and fistula formation between the cavity and left inferior lobar bronchus. (H) An enhanced CT follow-up scan at 6 months after MWA showing gradual involution of the cavity.
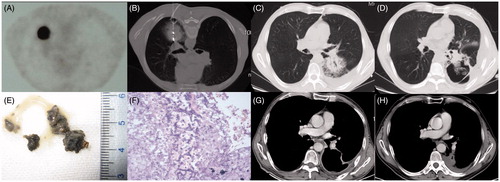
Figure 2. (A) A CT image from case 2 showing an isolated peripheral lesion of 36 × 35 mm located in the anterior segment of the right upper lobe. (B) MWA was performed with a mild pneumothorax. (C) A CT scan showing a minor pneumothorax and ipsilateral subcutaneous emphysema 3 days after MWA. (D) A CT scan depicting a flake of uneven and faveolate high-density shadow 3 weeks after MWA. (E) CT scan at 6 weeks after MWA showing an uneven thick-walled cavity with an irregular luminal surface, containing an air–fluid level and a beaded consolidation. (F) A drainage tube placed into the cavity under CT guidance.
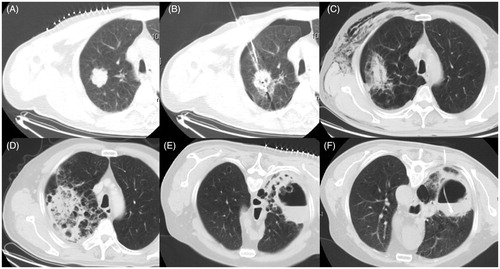
Figure 3. (A) Enhanced CT and MRI scan from case 3 showing a peripheral neoplasma 35 mm in diameter adjacent to an oblique fissure in the left lower lobe. (B) MWA was performed at a power of 70 W for an accumulated total time of 12 min. (C) CT follow-up scan at 48 h after MWA showing a GGO-like reaction band around the lesion encompassing the entire tumour. (D) CT scan on day 10 after MWA showing the stable GGO ablation zone. (E) Enhanced CT scan at 32 days after MWA showing a larger pneumothorax and atelectasis. (F) Follow-up CT scan at 2 months after MWA showing the formation of a bronchopleural fistula within the MWA cavitation that abutted the visceral pleura.
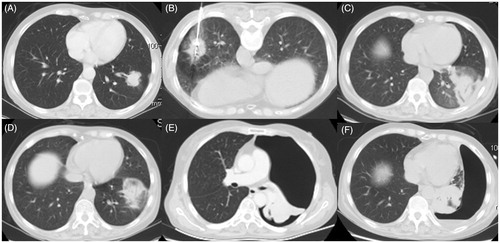
Table 1. Patient characteristics.
Table 2. Ablation, microbiology and treatment characteristics for the three cases.
Table 3. Level of certainty for the diagnosis of IPA for the three cases.