Figures & data
Figure 1. (A) The concept of MRI-controlled transurethral ultrasound therapy with multiple collimated high-intensity ultrasound beams. (B) Photograph of an MRI-compatible transurethral ultrasound applicator used to deliver high-intensity ultrasound energy to the prostate gland. (C) Photograph of the experimental system used in this study attached to the patient table of a clinical 3-T MR imager.
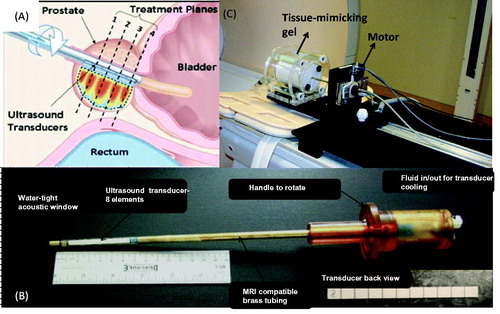
Table 1. Physical parameters used in acoustic calculation and bio-thermal simulation [Citation10].
Figure 2. Typical temperature profile along the direction of heating of an ultrasound transducer element.
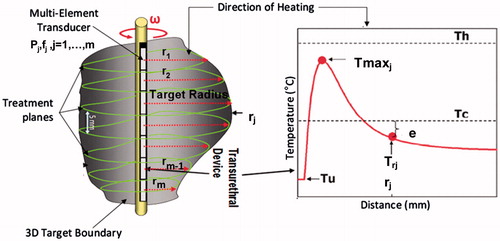
Figure 3. Geometrical description of the proposed algorithm.
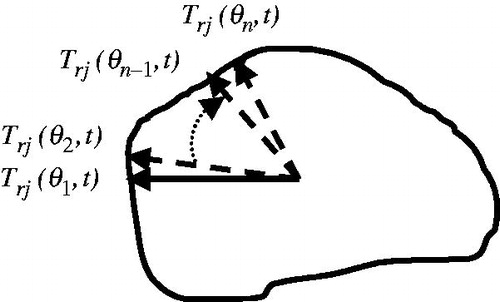
Figure 4. The mean value as well as the standard deviation of the error for different values of α across all patients.
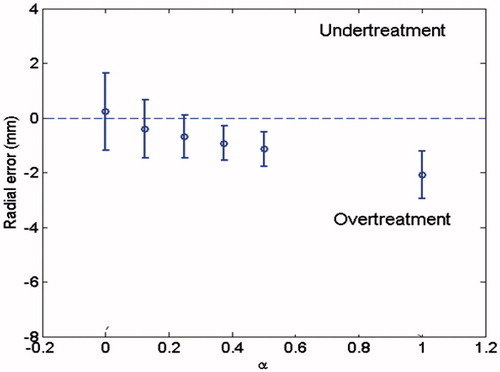
Figure 5. The mean value as well as the standard deviation of the error for different values of window size, n, across all patients.
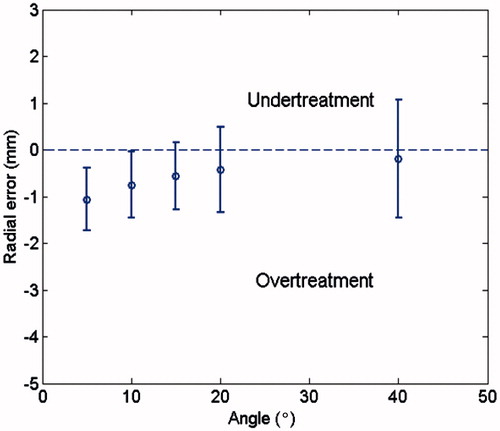
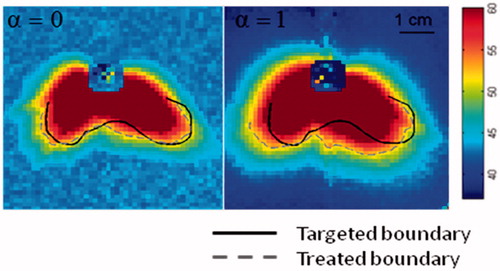
Figure 6. The pattern of conformal thermal heating for one element of ultrasound transducer with different value of α and the angle window of 15°.
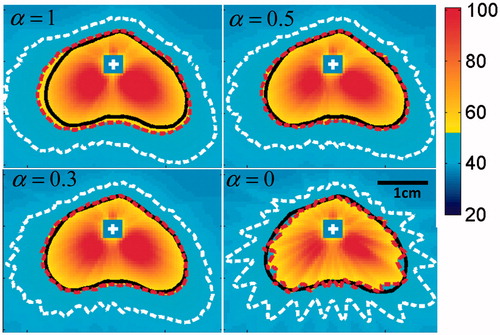
Table 2. The mean value as well as the standard deviation of the error across all patients.
Figure 7. The pattern of conformal thermal heating for two elements using different controllers (experimental results).
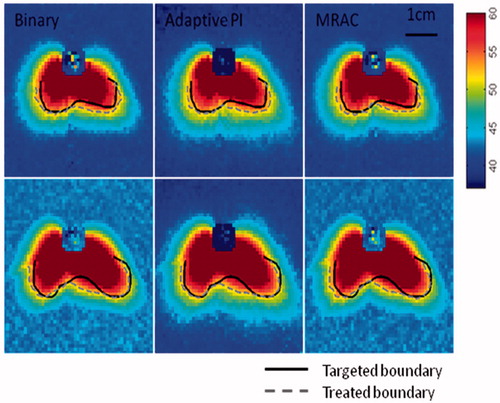
Figure 8. The difference between targeted and treated boundaries for two elements using different controllers.
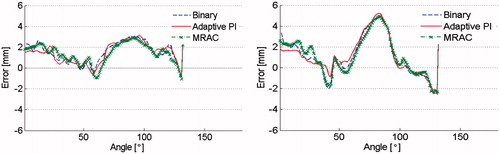
Figure 9. The pattern of conformal thermal heating for values of α using binary controller (experimental results).