
Figures & data
Figure 1. Schematic diagram of the ICNE-MGRE pulse sequence for fast conductivity imaging using optimised magnetic flux density data.
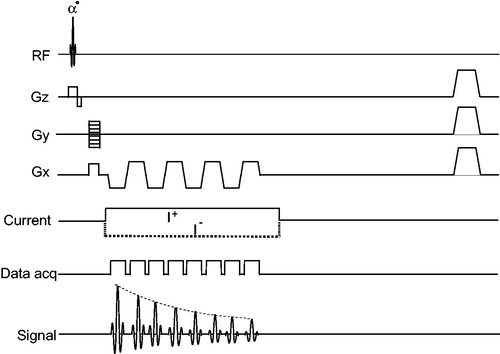
Figure 2. Experimental set-up to monitor RF ablation of ex vivo bovine muscle tissue using MREIT. (A) Chunk of bovine muscle tissue with a pair of RF ablation electrodes and a temperature probe for direct temperature measurements. (B) Non-magnetic silver needle (14 gauge) electrodes for RF ablation. (C) Diagram of the electrode and sensor configurations. (D) Cross-section of the bovine muscle tissue after RF ablation with a magnified view of the lesion (inset).
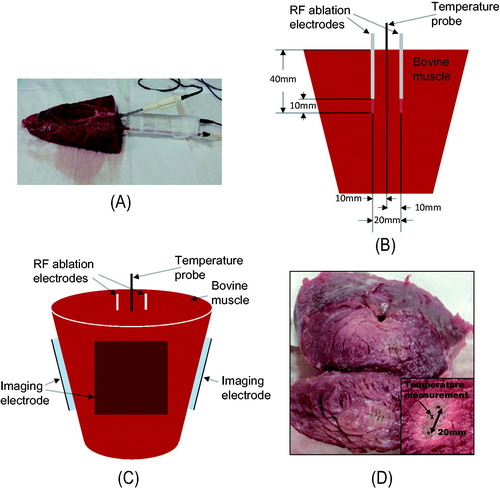
Figure 3. Example of acquired 8-echo MR images at every 10.24-s intervals. (A) Magnitude images of 8 echoes. (B) Magnetic flux density images of 8 echoes. (C) Optimal weights to be used to combine all images in (B) to compute the optimal magnetic flux density image from all 8 echo signals.
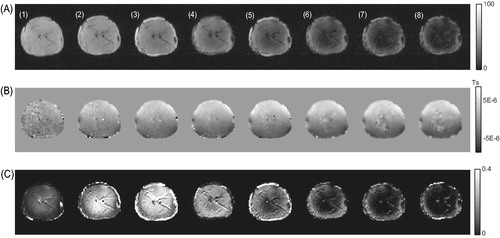
Figure 4. Effects of combining multiple echo signals on the quality of data. (A), (B), (C), and (D) are measured
data using 2, 4, 6, and 8 echoes, respectively, for the horizontal injection current. (E), (F), (G), and (H) are corresponding
data for the vertical injection current.
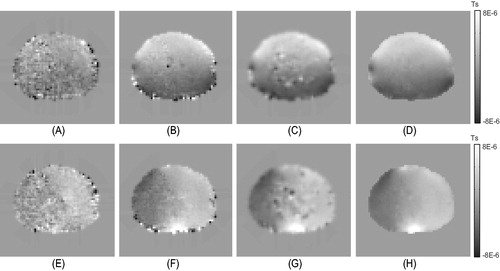
Figure 5. (A) MR magnitude image with two ROIs in the imaging slice where two ablations electrodes were located. (B, C) Spatiotemporal profile maps of the reconstructed conductivity values in two ROIs. (D) Plots of the directly measured tissue temperature and the output power of the RF generator.
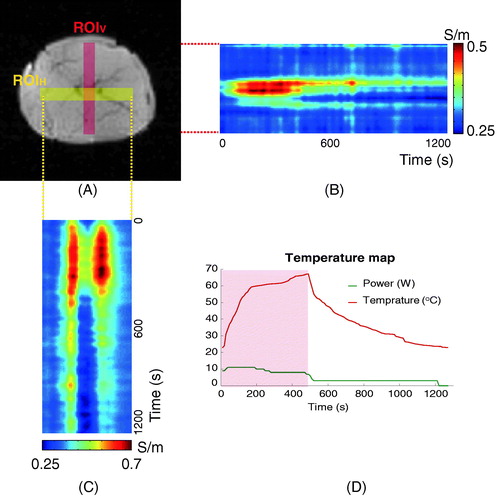
Figure 6. (A) Plots of the rCCR, directly measured tissue temperature, and RF output power. (B) Plot of the rCCR versus the tissue temperature. The six different stages marked as I to VI are defined in . The rCCR changed with the tissue temperature and also the structural factors such as tissue compositions and cellular structures. The rCCR value after RF ablation was larger than the initial value by about 20% due to permanent structural changes in the lesion by RF ablation.
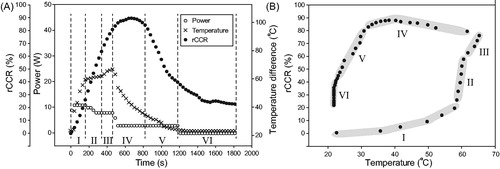
Table 1. Definitions of six intervals shown in .