Figures & data
Figure 1. Three example controller treatment plans for a simplistic treatment. (A) MRI slice taken perpendicular to the ultrasound beam-axis, on which the clinician identifies nine treatment voxels (TVs) and 14 protected voxels (PVs). The clinician groups TVs into cells (with each cell containing one or more TVs). During treatment, each cell is ablated sequentially as a ‘mini-treatment’ using a clinician-selected focal zone trajectory. (B) Plan 1 – single-pass heating: example of one extreme (one TV per cell) where the tumour is broken into nine treatment cells (number outlined in red at top left), each with only a single TV. Each cell is ablated while the focal zone is stationary at the circled location for the cell. The first number within each circle indicates the associated treatment cell of the focal position, while the second indicates the ordering of focal positions within the cell. For example, treatment of the first cell begins with the focal zone dwelling at position 1:1 until the controller’s model predicts that the cell’s single TV has been sufficiently heated, at which time treatment advances to the second cell (focal zone dwelling at location 2:1), and so on until finally reaching the ninth cell with the focal zone dwelling at location 9:1. (C) Plan 2 – multi-pass (volumetric) heating: the opposite extreme (all TVs in one cell) where all TVs are assigned to a single treatment cell that is ablated by repeatedly scanning the focal zone through positions 1:1, 1:2, … , 1:9, until the controller predicts the entire cell is treated. (D) Plan 3 – example of one possible treatment plan between the two extremes of Plans 1 and 2. The tumour is broken into three treatment cells, each of which is assigned three treatment voxels. Treatment begins with the focal zone stationary at 1:1 until all three TVs in its associated cell are predicted to receive their target dose, at which point the controller repeats the heating process for the second cell by moving the focal zone to location 2:1, and so on until all three cells are treated.
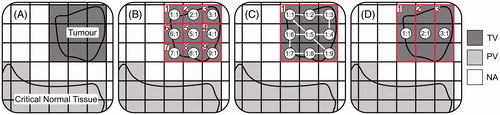
Table 1. Summary of treatment plan parameters.
Figure 2. Configuration of simulation volume. (A) The ultrasound beam propagates through 8 cm of water before entering the 10 × 10 × 10 cm tissue volume of muscle with a cylindrical tumour centred within it. (B) Zoomed-in view of the tumour and protected voxels shown in A. The tumour, (radius = 0.7 cm, height = 1 cm) is subdivided into three planes which are visited in the order (M) middle (z = 0 mm, geometric focus), (B) back (z = +3 mm), (F) front (z = −3 mm).
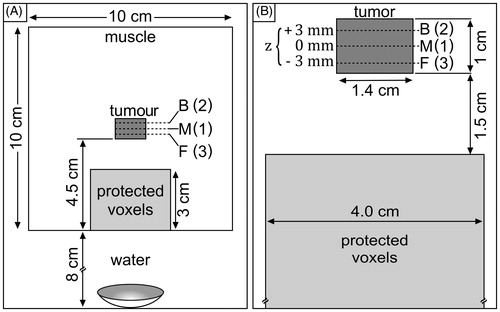
Figure 3. Middle plane (M) for the two simulated treatment plans. (A) single pass–hottest neighbour, (B) single pass–square spiral; grey, treatment voxels; bold/red outline, treatment cell; black dot, focal zone position for a cell. The starting focal zone location is marked with a white star, while the ending location is marked by a white square. The focal zone dwells at each location until the associated cell’s treatment is completed. Note: although not visible in this drawing, each treatment cell includes multiple TVs (∼3.4 on average) that extend in the direction perpendicular to the slice shown.
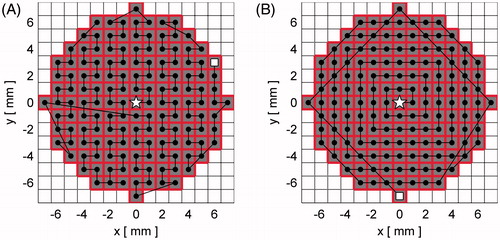
Figure 4. (A) Rabbit’s position during all controller tests. (B) Anatomical MR image of in vivo rabbit experiment in the transverse (left) and coronal (right) planes respectively. White box indicates approximate treatment location for run 1. (C) Controller configuration: single-pass–raster scan treatment plan with nine treatment cells covering a 5 × 5 × 3 mm volume. Each cell was heated by a single focal zone position (circles). Shading and outlines indicate to which cell each treatment voxel was assigned.
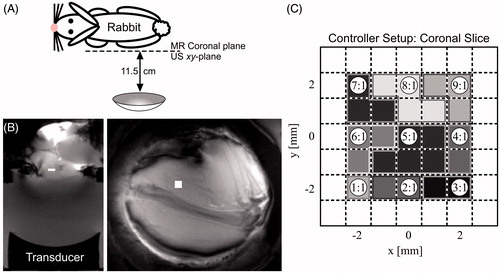
Figure 5. Treatment time and maximum protected voxel thermal dose as a function of treatment plan at 15 W. AMPC was used for all runs. SP-SS, single pass–square spiral; SP-HN, single pass–hottest neighbour.
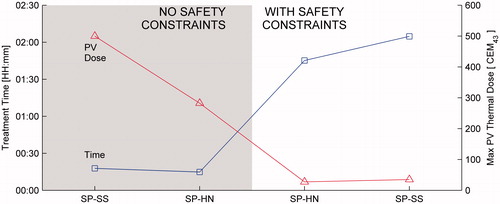
Figure 6. Treatment time and maximum dose delivered to protected voxels for the single pass–hottest neighbour treatment plan at 15 W as a function of optimisation feature when PV safety constraints are disabled (shaded region) and enabled (white region). IP, independent heating pulses (no optimisation); +TB, thermal build-up added; +PD, prior dose added; +AMPC, adaptive model-predictive control added. The maximum PV dose for +TB with no safety constraint is 3277 CEM43.
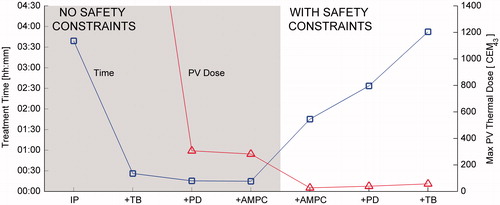
Figure 7. Effect of safety threshold on treatment time and maximum PV thermal dose for the single pass–hottest neighbour treatment plan at 15 W with AMPC. Shaded region: TOFF reduced in 0.5 °C increments, fixed TON = 41.5 °C. Unshaded region: TON reduced in 0.5 °C increments, fixed TOFF = 42 °C. Placing more stringent constraints on TOFF reduces dose delivered to protected voxels at the expense of increased treatment time. Reducing TON increases cooling time before the ultrasound is re-enabled, but also increases the available heating time before the next constraint violation occurs.
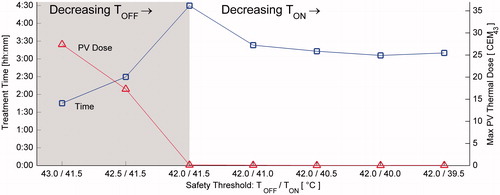
Figure 8. Histogram of final dose delivered as controller features are enabled. +Temperature build-up (+TB): (A) all treatment voxels, (B) minimum dose delivered to cells. +Prior Dose (+PD): (C) all treatment voxels, (D) minimum dose delivered to cells. +AMPC: (E) all treatment voxels, (F) minimum dose delivered to cells.
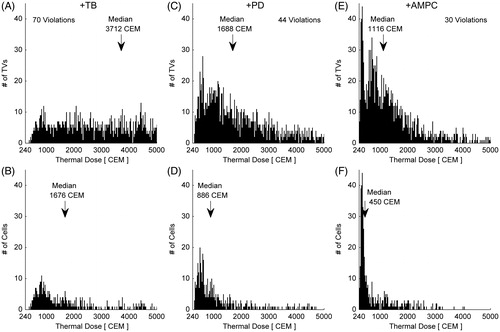
Figure 9. Treatment time and maximum protected voxel (PV) thermal dose as a function of applied ultrasound power for the single pass–hottest neighbour treatment plan run with AMPC and safety constraints enabled. Values in parenthesis indicate the number of safety violations for each case.
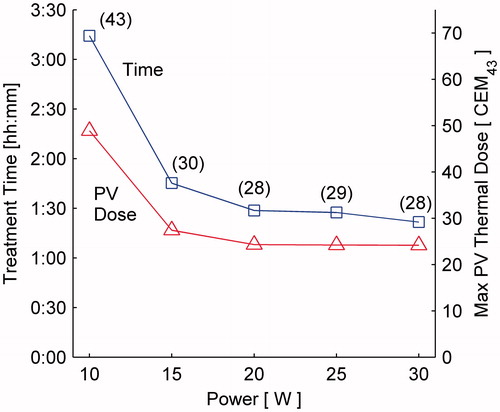
Figure 10. Treatment time (left) and maximum protected voxel thermal dose (right), as a function of MRTI acquisition interval; simulations run at 15 W with +AMPC or +PD (prior dose) optimisation with safety constraints enabled using the single pass–hottest neighbour treatment plan. Implementing AMPC decreases both the treatment time and maximum thermal dose in the protected voxels for any given MR acquisition interval.
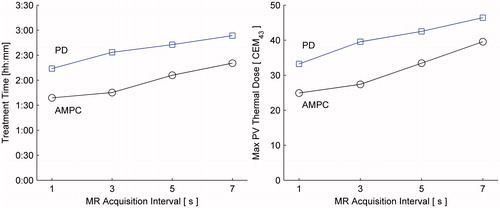
Figure 11. Final thermal dose maps in coronal slice of the treatment plane (perpendicular to ultrasound beam). Black squares indicate 1 × 1 × 1.5 mm treatment voxels. All treatment voxels were successfully treated, and minimal dose was deposited outside the prescribed treatment volume.
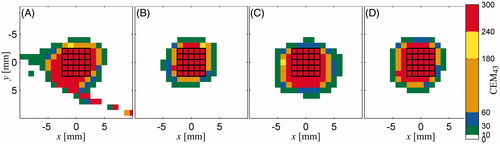
Figure 12. Prediction error as a function of measured temperature for all predictions made during a single treatment. MR measurements have σ = ±1.2 °C calculated from an unheated tissue region.
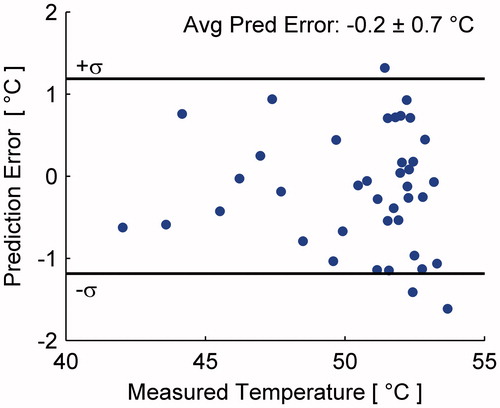
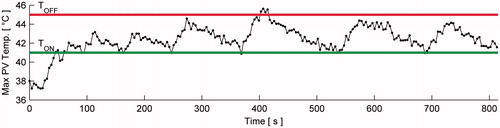
Figure 13. Protected voxels’ maximum temperature versus time during in vivo treatment with TOFF = 45 °C and TON = 41 °C. For this demonstration only, an additional safety feature forced the treatment of each cell to begin with protected voxel temperatures ≤TON. Maximum dose delivered to PVs was 8.4 CEM43.