Figures & data
Figure 1. Dimensions (out of scale and in mm) and boundary conditions of the two-compartment RFA model used in the present study.
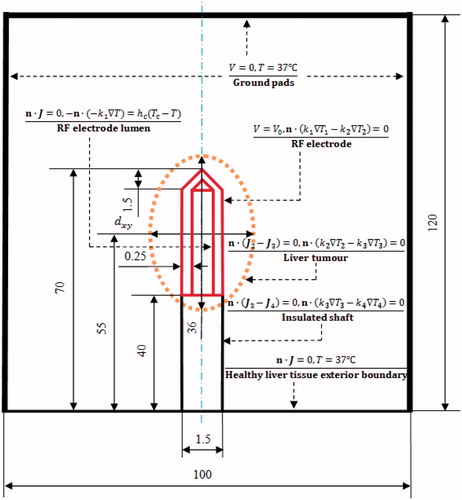
Table 1. Thermal and electrical properties of the modelling elements used in the present study.
Figure 2. Placements of the five measured points (out of scale, dimension in mm).
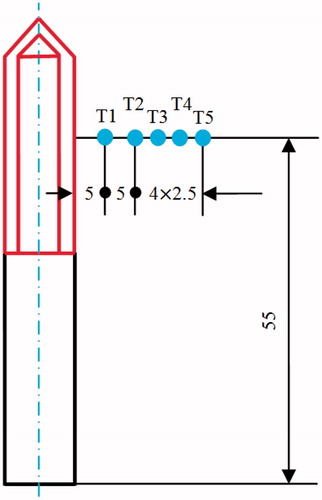
Table 2. Computational results for four target tissue sizes during different RFA protocols.
Figure 3. TTN volume for each target tissue size at different voltages applied: (A) = 20 mm, (B)
= 25 mm, (C)
= 30 mm and (D)
= 35 mm.
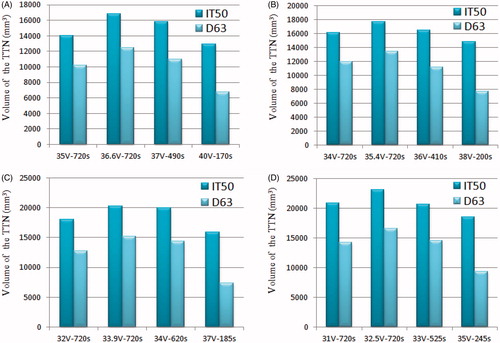
Figure 4. MVA without the roll-off occurrence for each target tissue size.
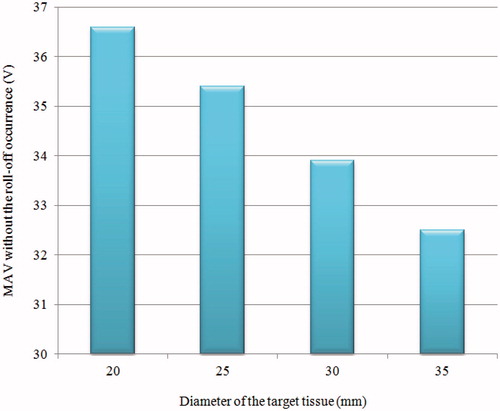
Figure 5. Computer simulation results for the TTN of target tissues of different sizes at the MVA (A) 100 °C isotherm, (B) temperature distribution (in °C), (C) tissue death (IT50) and (D) tissue death rate (%) (D63).
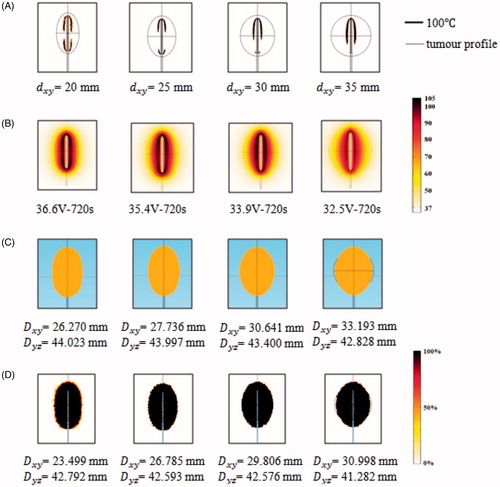
Table 3. Volumetric percentage of thermal damage to the healthy liver tissue during different RFA protocols.
Figure 6. Temperature change during the 12-min ablation procedure for each target tissue at its own MVA: (A) = 20 mm, (B)
= 25 mm, (C)
= 30 mm and (D)
= 35 mm.
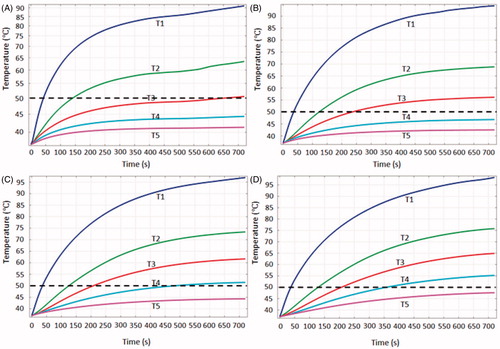
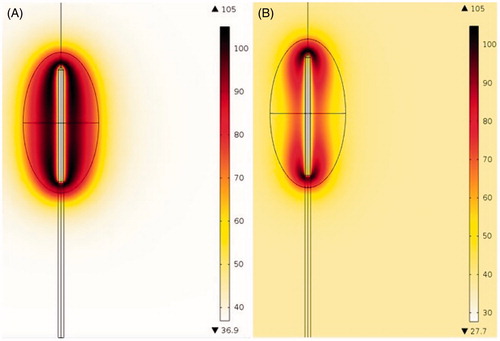
Figure 7. Temperature distributions (in °C) obtained with the two-compartment RFA model (A) and the homogenous RFA model (B).