1,312
Views
10
CrossRef citations to date
0
Altmetric
Research Article

Treatment of glaucoma with high intensity focused ultrasound

&
Pages 292-301 | Received 01 Sep 2014, Accepted 03 Nov 2014, Published online: 19 Dec 2014

Figures & data

Figure 1. Two-point perspectives of the entire human eye (A) and of the anterior segment of the eye (B).

Figure 1. Two-point perspectives of the entire human eye (A) and of the anterior segment of the eye (B).

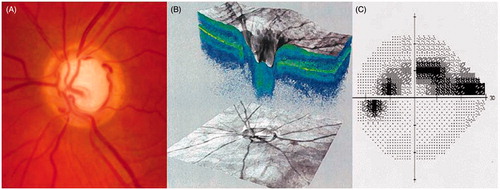
Figure 2. Optic nerve head photograph in a patient with glaucoma, showing visible cupping of the nerve (large central white part) (A). Optical coherence tomography scan of the optic nerve head, also showing the central cupping of the nerve (B). Visual field of the same patient, showing glaucomatous defects (grey and black points are locations of the space poorly or not seen by the patient, white points are locations of the space normally seen by the patient (C).

Figure 2. Optic nerve head photograph in a patient with glaucoma, showing visible cupping of the nerve (large central white part) (A). Optical coherence tomography scan of the optic nerve head, also showing the central cupping of the nerve (B). Visual field of the same patient, showing glaucomatous defects (grey and black points are locations of the space poorly or not seen by the patient, white points are locations of the space normally seen by the patient (C).

Table 1. Efficacy of diode laser cyclophotocoagulation procedures.

Table 2. Complications of diode laser cyclophotocoagulation procedures.
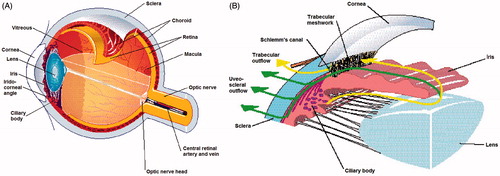
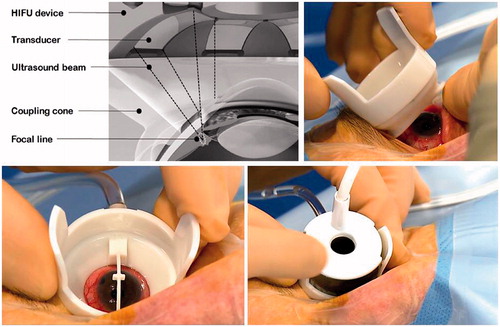
Figure 3. Schematic cross-section of the HIFU device to treat glaucoma (top left) and pictures of the device on a human eye (top right and bottom).

Figure 3. Schematic cross-section of the HIFU device to treat glaucoma (top left) and pictures of the device on a human eye (top right and bottom).

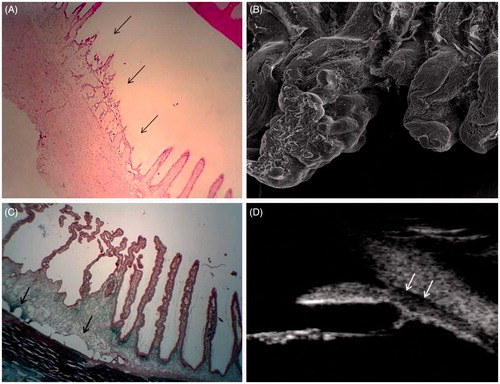
Figure 4. (A) Photomicrographs showing an entire lesion, with coagulation necrosis, loss of the bilayered ciliary epithelium and distension of the stromal collagen fibres (black arrows, magnification ×40). (B) Scanning electron microscopy of a treated ciliary process (left) and an untreated ciliary process (right) (×1000). (C) Photomicrographs showing an entire lesion, with also a fluid space between the sclera and the choroid (black arrows, magnification ×50). (D) Ultrasound biomicroscopy of a human eye 1 month after treatment, showing a hypoechoic fluid space between the sclera and the choroid (white arrows).

Figure 4. (A) Photomicrographs showing an entire lesion, with coagulation necrosis, loss of the bilayered ciliary epithelium and distension of the stromal collagen fibres (black arrows, magnification ×40). (B) Scanning electron microscopy of a treated ciliary process (left) and an untreated ciliary process (right) (×1000). (C) Photomicrographs showing an entire lesion, with also a fluid space between the sclera and the choroid (black arrows, magnification ×50). (D) Ultrasound biomicroscopy of a human eye 1 month after treatment, showing a hypoechoic fluid space between the sclera and the choroid (white arrows).

Reprints and Corporate Permissions

Please note: Selecting permissions does not provide access to the full text of the article, please see our help page How do I view content?

To request a reprint or corporate permissions for this article, please click on the relevant link below:

Academic Permissions

Please note: Selecting permissions does not provide access to the full text of the article, please see our help page How do I view content?

Obtain permissions instantly via Rightslink by clicking on the button below:

If you are unable to obtain permissions via Rightslink, please complete and submit this Permissions form. For more information, please visit our Permissions help page.