Figures & data
Figure 1. MCL-induced hyperthermia in a rat model of tibial defects. Composites of alginate gel with MCLs were implanted into the tibial defects, and then subjected to irradiation with an alternating magnetic field. The desired temperature could be achieved by adjusting the magnetic field intensity. A graph showed temperatures on the surface of the compound in rats treated with hyperthermia, measured with a thermofibre probe. Results are expressed as the mean ± SD (n = 3).
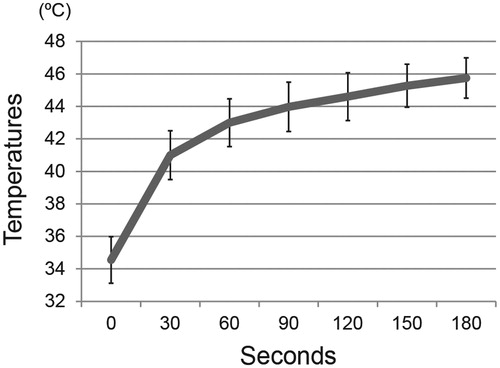
Figure 2. Radiographic evaluation for targeted hyperthermia. (A) Temporal change in radiographs of the right tibia in the control and hyperthermia groups (representative images of 43–46 °C) at baseline (0W), 2 weeks (2W), 4 weeks (4W), and 6 weeks (6W) after implantation. Hyperthermia was applied at the time of implantation (once, for 15 min). At 2 weeks, the radiodensity around the tibial defect in the hyperthermia group (arrows) was increased compared with that in the control group. (B) Changes in the radiodensity of right tibias from baseline to 2 weeks after implantation were plotted on a graph in the control (n = 8) and hyperthermia groups (n = 32). The radiodensity of right tibias at two time points (0 and 2 weeks) was normalised with reference to that of left tibias. (C) Changes in radiodensity in each hyperthermia group (43–46 °C, n = 8 each) and 42 °C (n = 5) from baseline to 2 weeks after implantation were plotted on a graph. The radiodensity in groups treated at 45 °C and 46 °C was significantly increased compared with the control group. Data are expressed as the mean ± SD. *p < 0.05 compared with control group. **p < 0.01 compared with control group. (D) Representative sagittal images of the right tibia with µ-CT in the control and hyperthermia groups (45 °C) at 2 weeks after implantation. Consolidation around the tibial defect in the hyperthermia group (arrows) was increased compared with that in the control group (arrowheads). (E) The bone volume/tissue volume (BV/TV) around the tibial defect at 2 weeks after implantation was plotted on a graph for the control (n = 2) and hyperthermia groups (45 °C and 46 °C, n = 2). The BV/TV around the tibial defect was greater in the hyperthermia group than in the control group. Data are expressed as the mean ± SD.
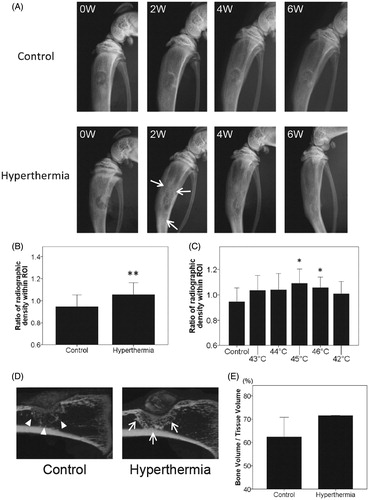
Figure 3. Histological findings at 2 weeks after implantation. (A) Representative sections at 2 weeks after implantation with H&E staining in the control group and all types of the hyperthermia group (43–46 °C) are shown. Sections of all hyperthermia groups revealed increased newly formed bone around the tibial defects (arrows) compared with the control group (arrowheads). Bars indicate 2 mm. (i) Control. (ii) Hyperthermia at 43 °C. (iii) Hyperthermia at 44 °C. (iv) Hyperthermia at 45 °C. (v) Hyperthermia at 46 °C. (original magnification ×20). (B) The histomorphometrical analyses used Image J software for quantification. Ratios of newly formed bone area were plotted on a graph. (C) Ratios of newly formed bone at each temperature (43–46 °C) and control were also plotted. Data are expressed as the mean ± SD. *p < 0.05, **p < 0.01.
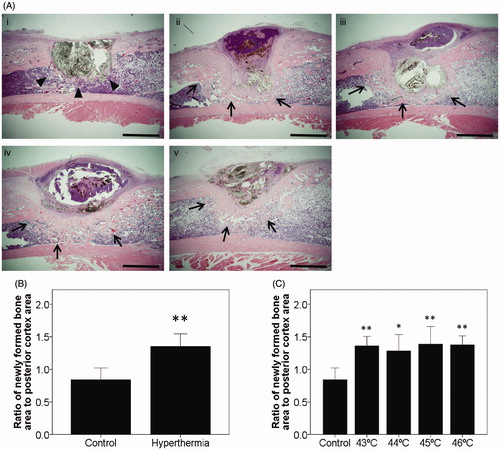
Figure 4. Immunostaining for evaluation of bone turnover. Sections from the control and hyperthermia groups at 2 weeks after implantation were stained with H&E (A and B, original magnification ×20) (Bars indicate 2 mm), ALP staining (C and D, original magnification ×400), and TRAP staining (E and F, original magnification ×400) (Bars indicate 100 µm). (A, C, E) depict control group. (B, D, F) depict hyperthermia group (44 °C). ALP positive staining was prominent at the boundary adjacent to MCLs composites in the hyperthermia group (D; arrows). TRAP-positive multinucleated cells were observed in the area adjacent to MCLs composites in the control group (E; arrowheads). Interestingly, TRAP-positive cells were also observed in established trabecular bone in the hyperthermia group (F; arrowheads).
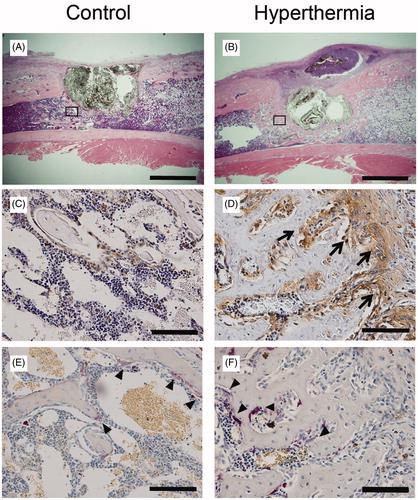
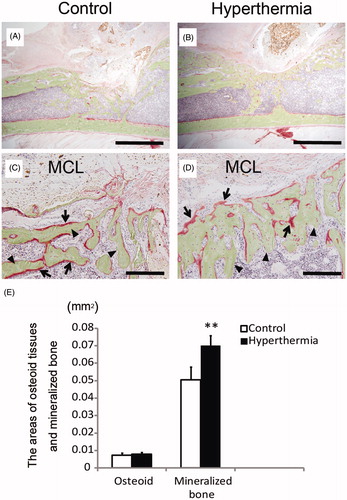
Figure 5. Villanueva bone staining. Undecalcified specimens at 2 weeks after implantation were subjected to Villanueva bone staining. (A and C) Control group. (B and D) Hyperthermia group (43 °C). Images of low magnification (A and B; original magnification ×20) (Bars indicate 2 mm) and those of high magnification (C and D; original magnification ×200) (Bars indicate 200 µm). Osteoid tissues were stained red (C, D; arrows) and mineralised bone was stained green (C, D; arrowheads). (E) The areas of osteoid tissues and mineralised bone were calculated and plotted. The area of mineralised bone formation in the hyperthermia group was significantly increased compared with that in the control group, whereas the area of osteoid tissues did not differ between the control and hyperthermia groups. Data are expressed as the mean ± SD. **p < 0.01.